

All investment strategies have the potential for profit and loss, your or your clients’ capital may be at risk.
From economic supremacy to electronic powerhouse – cornering the market with cameras, consoles and the Sony Walkman – to the birthplace of the Prius, Japan has an enviable record as an industrial superpower.
Whether you associate the country with corporate reform, manga, sushi or sake, this enigmatic collection of islands offers more than meets the eye.
Today, Japan has once again piqued international interest. Having escaped the shadows of its Lost Decades and reached new market highs, the most apt question is: where do the opportunities now lie?
The following four themes are experiencing accelerating momentum and appear poised for reappraisal:
01. From paper to platforms: a domestic digitalisation story
Whether it’s due to the limited supply of labour, rising wages or the need for productivity gains and scale advantages, Japan is slowly but surely shifting online.
The country has lagged other developed markets across most areas of digitalisation, including ecommerce, cashless payments, software-as-a-service and general enterprise IT investment. However, the nation has now recognised the need to develop these labour-saving solutions. This shift opens up significant long-term growth opportunities.
Although these opportunities are still in their infancy – and are therefore less prominent than in other developed markets – the companies likeliest to benefit are not priced at a premium to the broader market, making them attractive to patient investors.
Rakuten’s average yearly growth rate (2020-2023) versus industry equivalent
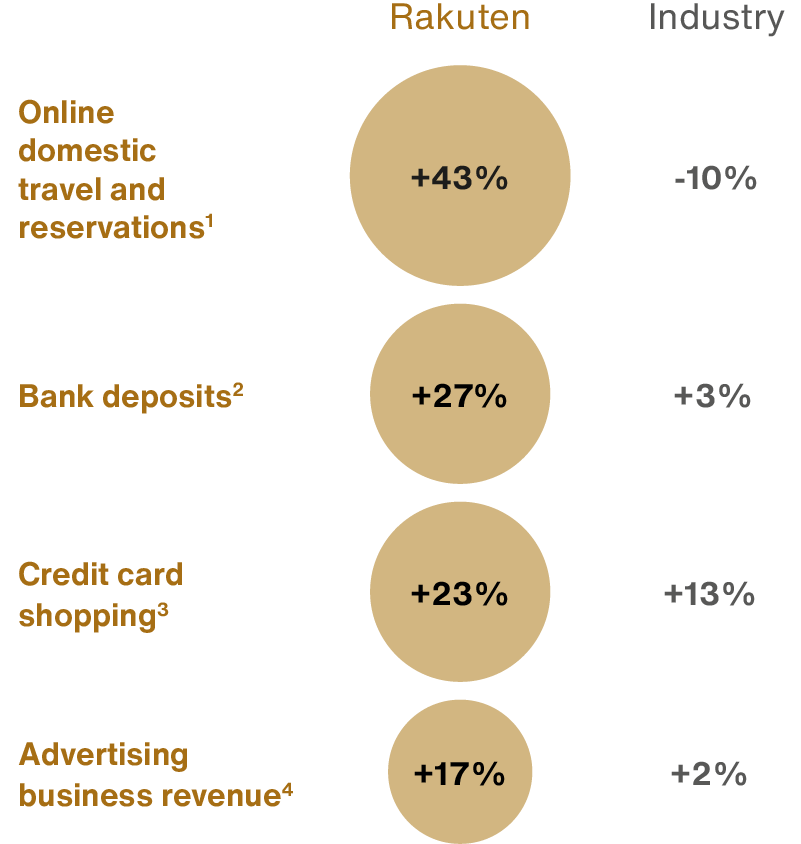
[1] Rakuten Travel domestic hotel checkout gross transaction value (excluding corporate customers; dynamic packages only include Rakuten Travel gross merchandise sales) versus data from the Japan Tourism Agency on travel agency transaction amounts
[2] Rakuten Bank versus data from Japanese Bankers Association on national bank deposits.
[3] Rakuten Card versus data from the Ministry of Economy, Trade and Industry’s Statistical Survey on Dynamics of Specified Service Industries: Credit Card
[4] Rakuten versus data from Dentsu: 2020 Advertising Expenditures in Japan
Source: Rakuten Group, Inc. 2024
Online conglomerate Rakuten is home to Japan’s largest loyalty points programme. More than 100 million members access upwards of 70 online services from its ecosystem, ranging from hotel bookings to brokerage and banking. Despite achieving consistent revenue growth across the 27 years since its inception, the company’s stock trades at a mere 0.6 times price-to-sales ratio. That's half the market average, meaning other investors appear to undervalue it. The reason for their caution is because of Rakuten’s capital-intensive decision to develop its mobile phone network. This venture required a significant outlay. However, its accelerating pick-up in paying subscribers could make the network profitable by year-end.
If Rakuten Mobile grows its share of the Japanese market from about 4 per cent to 10 per cent, the parent group’s enterprise value could double (ie its total value, taking debt and cash reserves into consideration). In addition, the division could add value to the entire ecosystem. By providing another customer touchpoint, the business improves Rakuten’s access to data and could help the parent company cross-sell more services.
Other examples include:
GMO Internet: The internet infrastructure provider offers picks-and-shovels exposure to Japan’s growing digital goldmine. The firm is Japan’s market leader in hosting and registering websites, esignatures, cybersecurity, cashless payments and cloud services. Despite boasting such a long list of services, the group’s shares trade at a discount to the value of the sum of its parts, creating the potential for significant gains even accepting conservative growth assumptions.
SBI Holdings: After spinning off from Softbank Group in 2006, the company quickly became the country’s largest brokerage business. It used that success to spread its reach into adjacent areas of finance, including insurance, banking and asset management, upsetting the sleepy incumbents. It has a 24 per cent compound annual growth rate (CAGR) for the last five years (representing its average yearly growth over the period). In achieving that, it has outpaced its peers but still trades at a similar earnings multiple - comparing its stock price to its annual profit - to the broader banking sector.
CyberAgent: This Sony-esque collection of synergistic businesses includes gaming, media and online advertising. Although AbemaTV’s build-out has eaten into margins, the on-demand media platform has recently become profitable. Since activating the service, the platform’s weekly active users have increased to 24 million and continue to grow at rates exceeding 20 per cent.
Although Softbank Group is more focused on global markets than the companies mentioned above, it is still notable for being equally underappreciated despite its prominent role in funding disruptive technology. What’s more, the company’s fortunes seem to have turned around. The share price value of its holdings has doubled over the last 12 months, its exposure to China and private companies has reduced and it has shifted more towards a globally diverse play on listed stocks. Moreover, Softbank’s historically low borrowing level gives it a substantial war chest for opportunistic growth.
Despite these improvements, Softbank’s share price still lags its net asset value growth. This widening discount offers significant potential for long-term investors.
02. Accelerating automation
The rise of Japan’s auto industry in the 1980s coupled with its cultural proclivity for quality and continuous improvement (or kaizen) have helped cement the nation’s place as a powerhouse for robotics and automation. Today, the country manufactures about half of the world's industrial robots.
Demand for robotics and automation is only accelerating. Automated solutions provide firms with insurance against geopolitics and vulnerable supply chains and provide pandemic-proof production lines. An ageing population and rising wages are also reducing those solutions’ payback period. And their application or addressable market is beginning to expand beyond the factory floor and unpopular ‘3D’ (dangerous, degrading and dirty) jobs. Technological improvements in dexterity and sensory systems, AI and the Internet of Things allow for an array of new opportunities, from assisting the elderly and infirm to field-based robotics, such as fruit picking.
Keyence, a factory automation company specialising in machine vision, is arguably the best example of Japan’s pre-eminence in this field. It provides robots’ eyes: vision systems with unblinking lenses that detect and interpret flickers of patterned light, making it possible to check the seal of your yoghurt cup or catch a single flawed spiral amongst a million tumbling screws. As more processes become automated, this area is forecast to outpace global capital expenditure and grow twice as fast as robots.
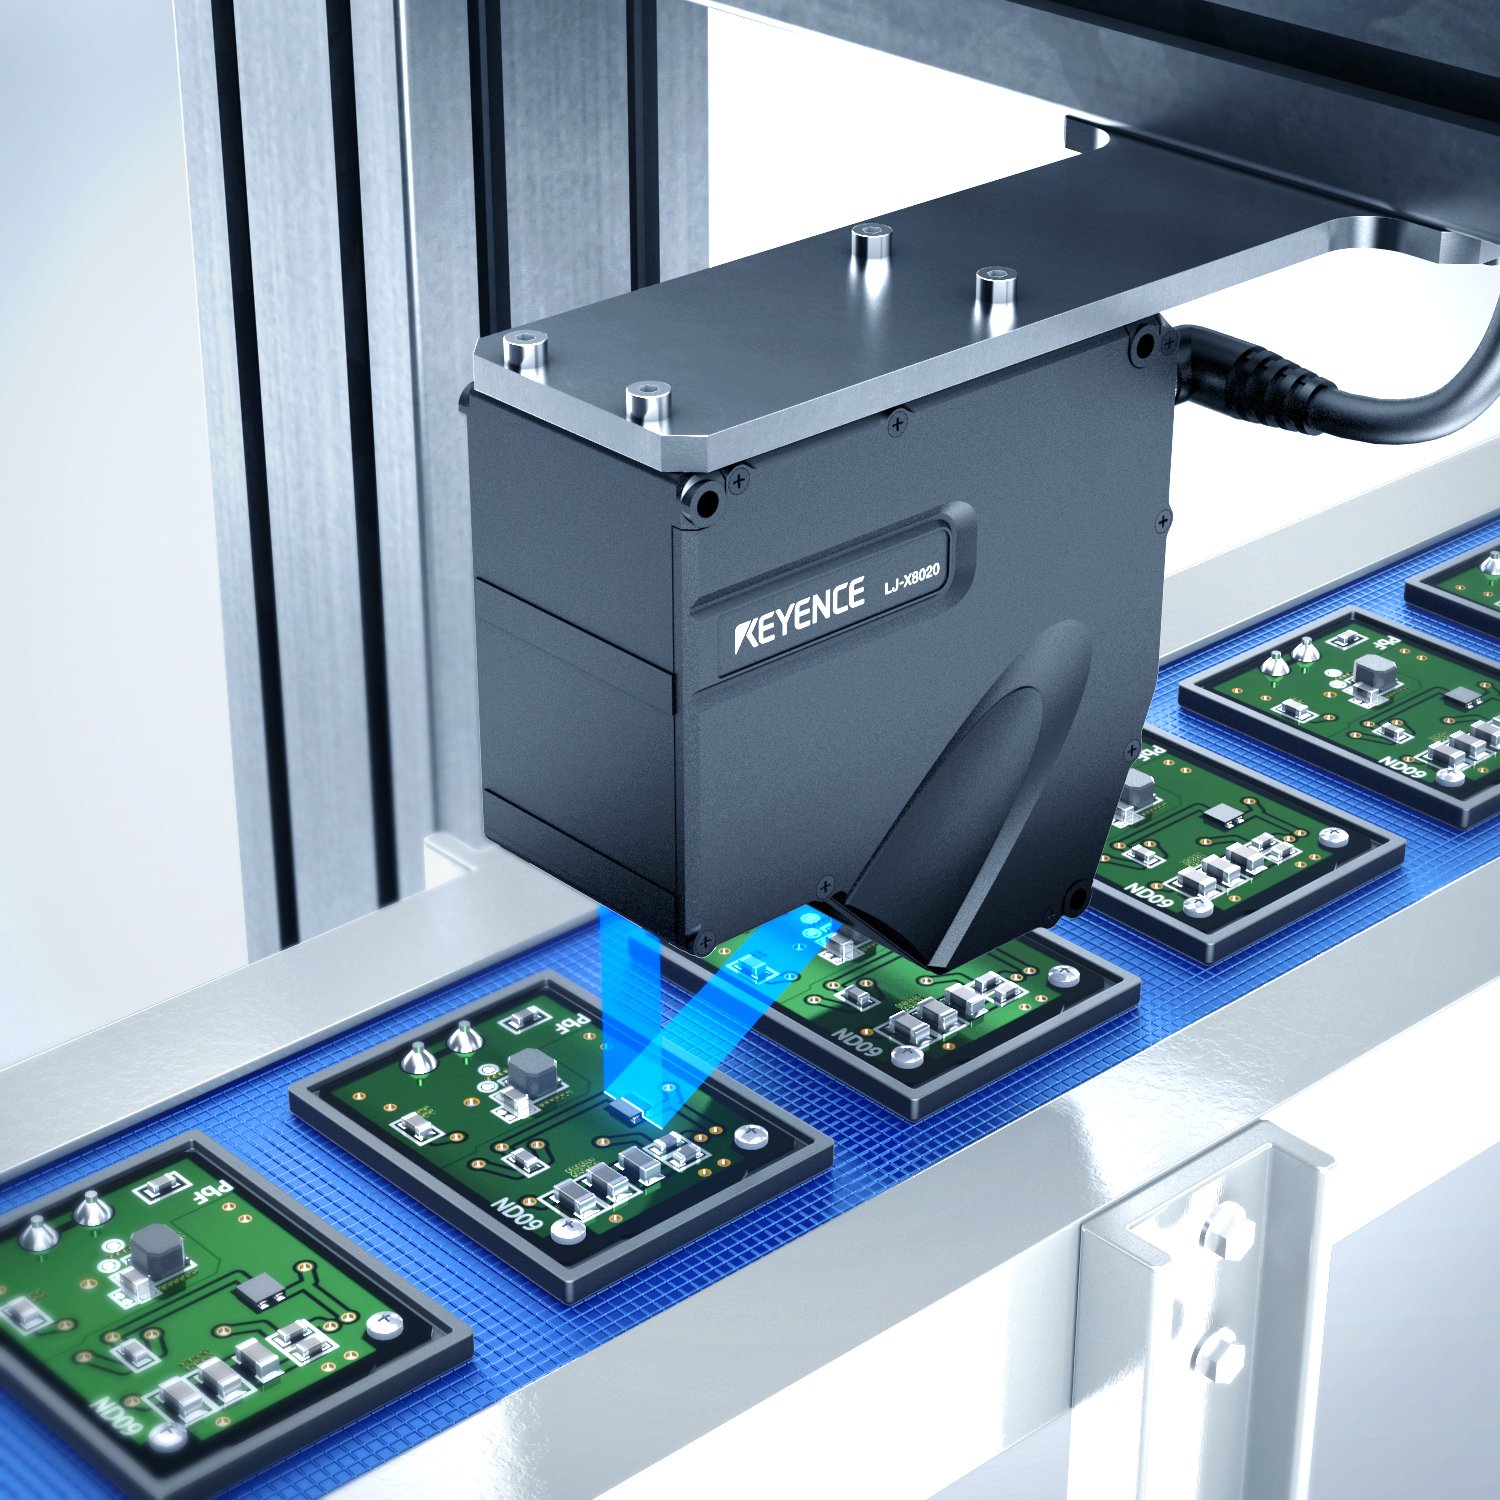
© Keyence Corporation
Keyence’s enduring edge expands beyond its comprehensive machine vision products. Its direct-sale, consultant-style business model identifies customer pain points and solves them. This allows the firm to enjoy margins more commonly associated with internet companies (gross profit margins of over 80 per cent and operating profit margins of over 50 per cent). Moreover, Keyence is a lead innovator in this field, with 70 per cent of its products being world-firsts. With a strong brand and superlative customer relations, this incumbent giant appears well-positioned to ride several structural growth trends into the future.
DMG Mori, a child of both Japanese and German precision engineering, is a beacon of innovation in the machine tool industry. Its superior five-axis machines boast 1-micron accuracy levels – smaller than a virus. This allows precision manufacturing at scale, cutting its clients’ manufacturing costs by:
- replacing their need for multiple machine tools by 50 per cent
- reducing the number of operators they require on the factory floor
- increasing their utilisation rates (the proportion of hours their staff are doing billable work rather than other tasks)
At present, these five-axis machines represent 20 per cent of DMG Mori’s sales. But we expect the increasing use of complex, precision parts by the aerospace, medical devices and semiconductor industries, among others, to make them a larger part of the pie.
03. Tapping the rising wealth of Asian neighbours
Asia is home to many people: five billion and counting, representing 60 per cent of the global population. Many of these are young and getting wealthier. Two-thirds of the world’s youth live in Asia. And of the 113 million people who will join the global middle class in 2024, most will come from Asia.
This presents a big market with rising discretionary and disposable spending power, creating premiumisation trends across several product types. The ‘Made in Japan’ brand stamp has become synonymous with prestige and high quality across the region, putting the country and its brands at the forefront of this opportunity.
Skincare is just one example. Spend on the product is only $36 per person in China, indicating room for growth, compared to over $100 in South Korea, Taiwan and Singapore. The skincare sector has many attractions to growth investors. It enables the creation of durable, powerful brands. It gains from the strong interplay between scientific innovation and the strong emotions consumers have about appearance and youthfulness. It offers the freedom for extensive advertising. And it has the advantage of being a ‘chronic’ treatment, where consumers make lifelong commitments to product lines to maintain their benefits.

© Shiseido Company, Limited
Shiseido is at the forefront of this trend. It began as Japan’s first western-style pharmacy in 1872 before branching off into ‘cosmeceutical’ products – cosmetics with pharmaceutical effects. In 1897, it created Eudermine. Repeatedly reformulated over the decades to take advantage of scientific advances, it remains on sale today. More broadly, the company continues to develop its expertise in skincare technology, historically spending far more on research and development as a percentage of sales than L’Oréal and Estee Lauder.
Although the Covid pandemic and other setbacks led to weaker demand for the brand in China, denting profit margins, it is now recovering in that market. Furthermore, the firm’s focus on prestige brands targeted at Asian consumers now puts it in a position to fulfil its broader long-term growth potential.
04. Addressing an ageing nation’s ailments
Japan’s demographic picture is well documented. The population has been in decline for more than a decade, with one in 10 citizens now over the age of 80. Although the situation is stark, it is not isolated. Globally, one in 10 people are over 65 years of age, and in just three decades it is estimated that this will rise to one in four in European, North American and Asian countries.
This has various economic and social implications. One is the increasing prevalence of age-related ailments, including Alzheimer’s disease: the most common type of dementia and the leading cause of death in the UK. It is estimated that 10 per cent of those over 65 and about 50 per cent of people over 85 suffer from the brain disorder. This presents a patient population that will explode as the population pyramid bulge shifts upwards.
Eisai, a Japanese pharma company focusing on neurology and oncology, appears on the front foot of this endemic. It has a rich history with Alzheimer’s, dating back to the 1990s with Aricept (donepezil), which became the world’s best-selling drug for the disease, addressing some of its symptoms. The firm’s recent partnership with Biogen resulted in Leqembi (lecanemab). It is the first drug to target one of the suspected root causes of the disease: amyloid-beta plaque build-up within the brain.

© Eisai Co, Ltd
The US, Japan and China have all approved the drug’s use. This opportunity offers significant potential for growth, marking a first in the industry. And there is the promise of enhancements to come, notably through more straightforward delivery methods. Diagnostic advances may also enable Eisai to focus on individuals in the pre-clinical stages of Alzheimer’s, creating a further route for market expansion.
Olympus reframed its opportunity from recreational use of camera technology towards medicine. It now commands over 70 per cent of the market in gastro endoscopes – cameras used to detect and diagnose problems within the gastrointestinal tract. Although Covid diverted short-term medical expenditure, it amplified the importance and need for the provision of diagnostic services in the long run. China’s lack of diagnostics, for example, resulted in a five-year survival rate for gastric cancer of only 35 per cent. That contrasts with Japan’s 80 per cent rate. This suggests a healthy prognosis for industry incumbents like Olympus.
What next for Japan’s recent cyclical stars?
Despite the many exciting growth prospects already detailed, recent investor enthusiasm has centred on ‘cyclical’ companies, whose performance closely correlates with Japan’s overall economic cycle. These encompass many of the country’s biggest firms.
So, to have outperformed the market over the past three years, you needed to invest in transport, resources and finance.
A three-year period of share-price gains concentrated on the cyclicals
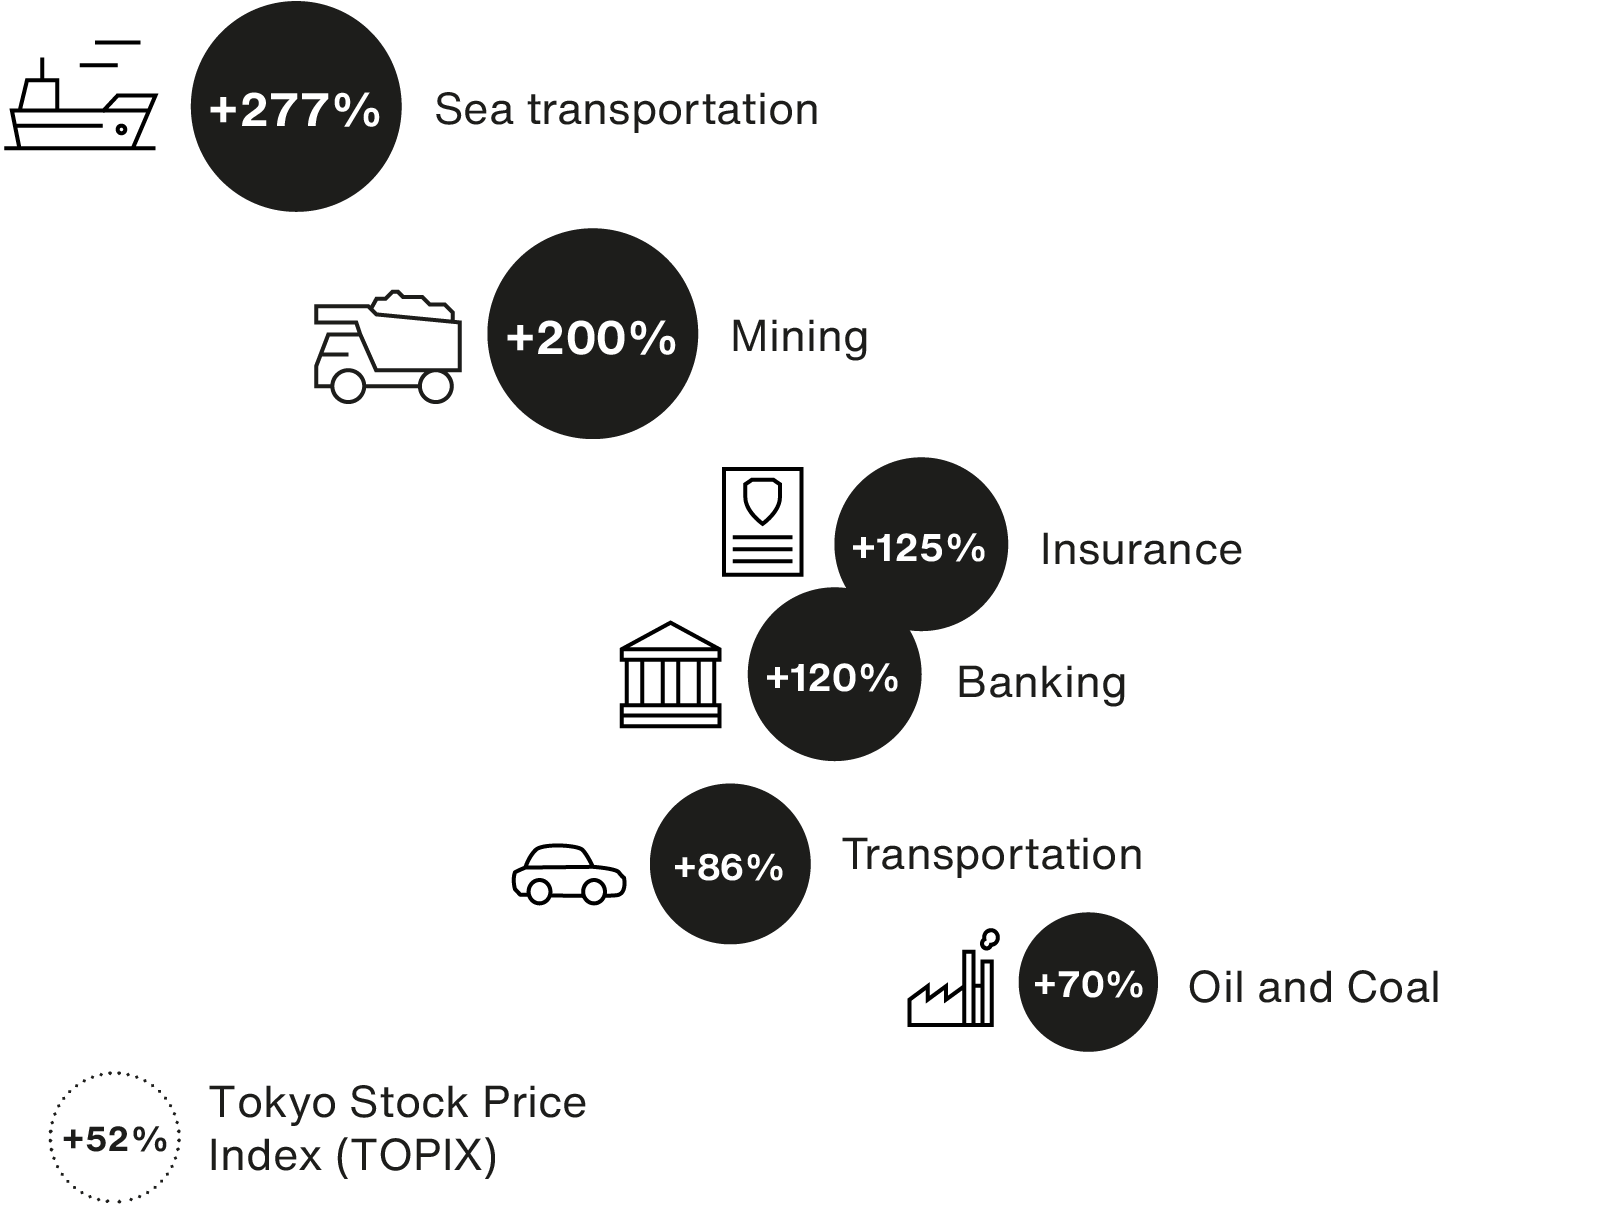
Source: Japan Exchange Group. As at 1 April 2024.
The question is: can Japan’s large blue chips maintain this momentum or is their fortune a short-term phenomenon?
01. Are Japan’s autos running on empty?
The economic bounce-back from Covid helped revive an economy that remains geared towards global sales. Nowhere is this more evident than in automobiles, Japan’s largest industry and export.
The post-pandemic recovery resulted in a sharp acceleration in volumes, with the global auto industry enjoying double-digit growth for the second time in over 20 years. This aided the largest player, Toyota, whose market value doubled.
Global auto sales
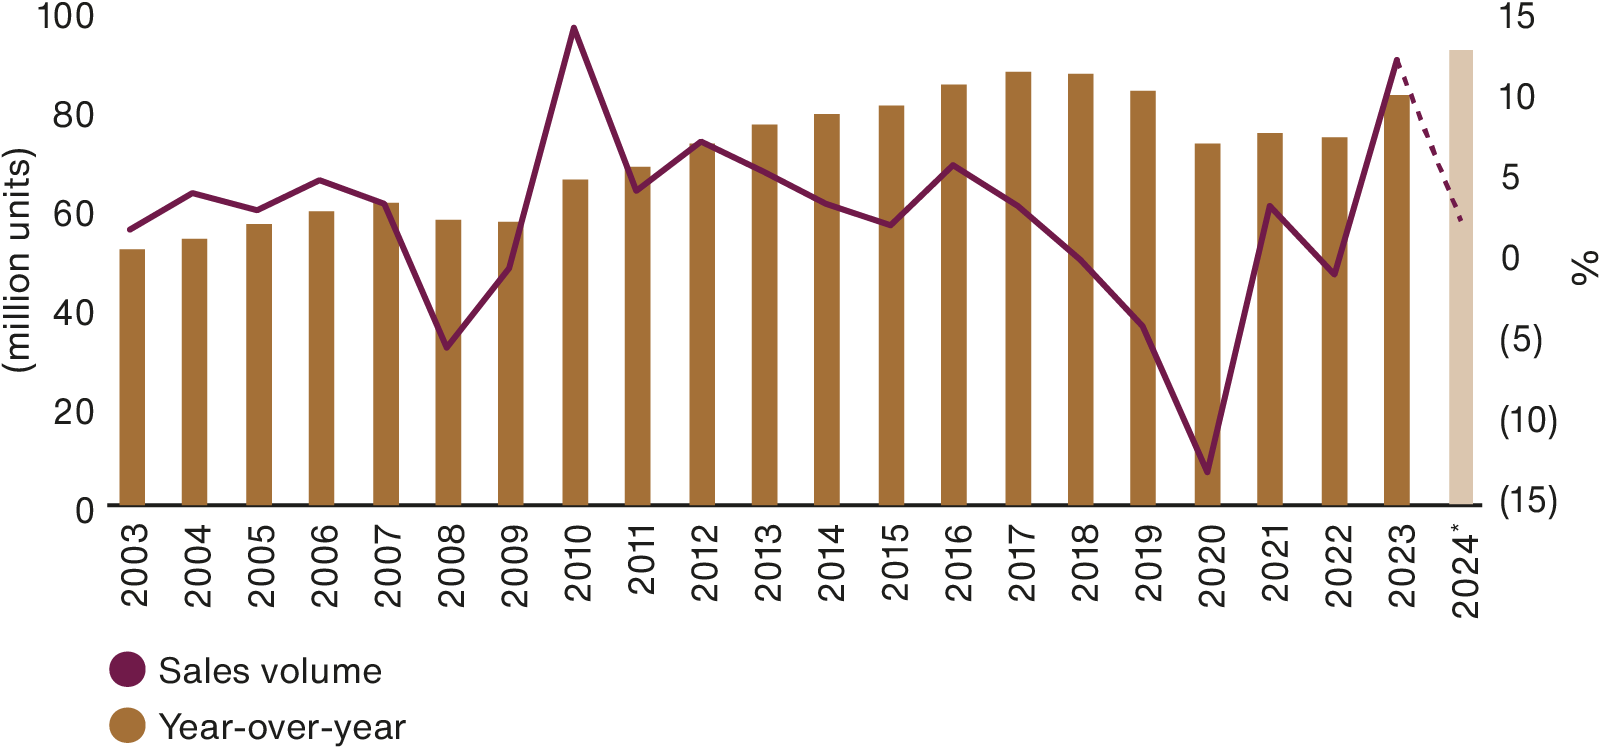
Source: CLSA Research, 2024.
*estimate
However, an inevitable slowdown in orders coupled with a broader transition towards electrification could cast doubt over sustaining this level of earnings growth. For example, Honda expects adapting to electric vehicles to cost it in the region of ¥10tn ($62bn).
Indeed, at the time of writing, Toyota had already downgraded its forward operating profit guidance by ¥1tn below consensus estimates.
02. Dining out on a weak yen, how long can this continue?
In addition to the economic bounce-back, Japanese exporters have been helped by the yen’s decline, meaning US-dollar earners can buy more of its goods for the ‘same price’. It is now back to where it was in 1990, when Margaret Thatcher was prime minister, Nelson Mandela left prison and Germany reunited. This is extreme, even before you account for relative prices.
On a purchasing power parity basis, comparing the price of specific goods in different countries, the yen is now almost 50 per cent undervalued. And the ‘real effective exchange rate’, which takes account of differences between the various countries’ inflation rates, is at levels not seen since the summer of 1969!
Japan real effective exchange rate
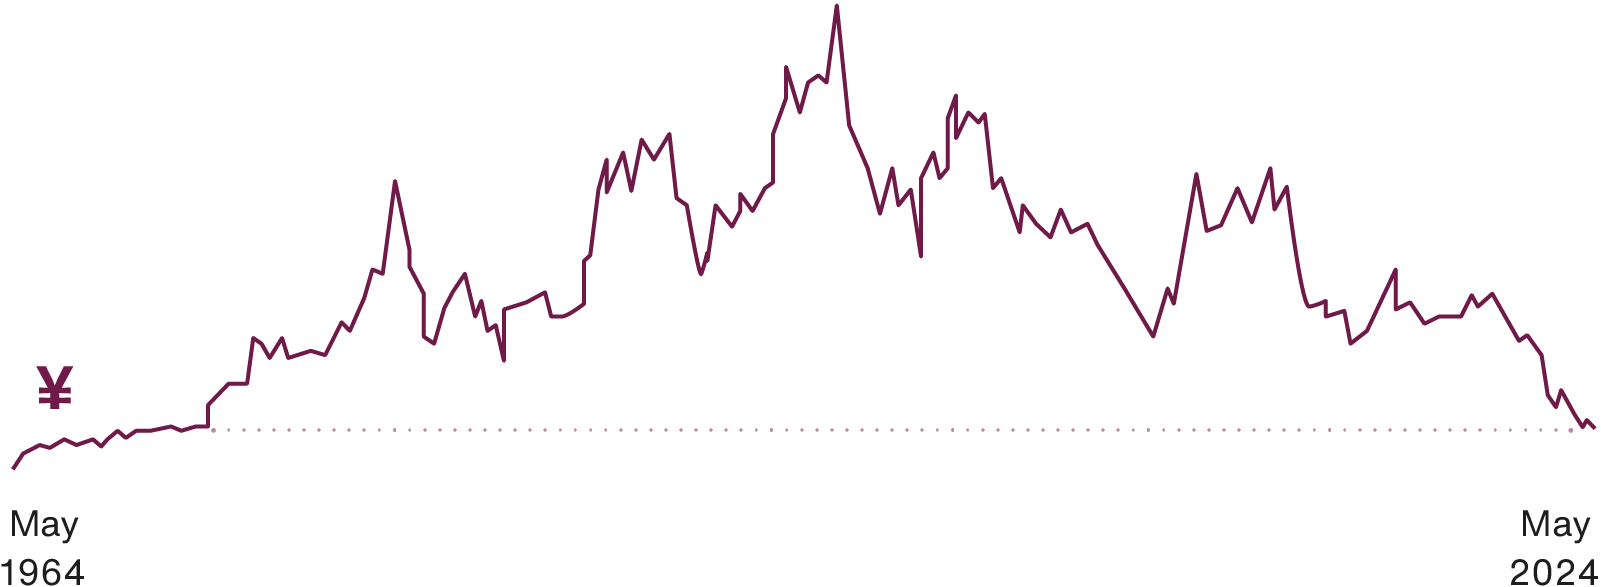
Source: CLSA Research. As at 10 May 2024.
Big Mac, big difference
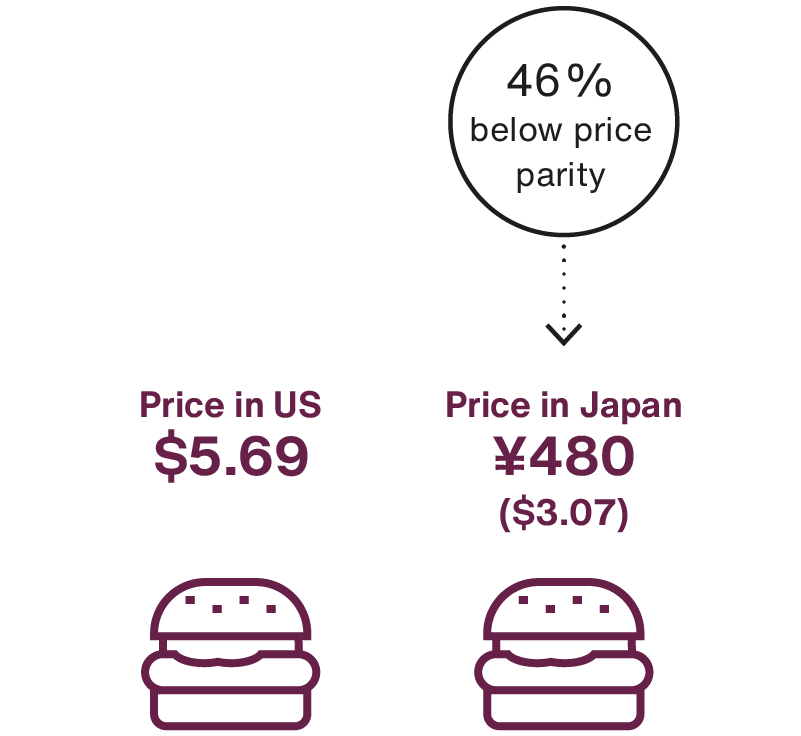
Source: Statista, 2024. Details: Worldwide;
IMF; McDonald’s; Thomson Reuters; The
Economist; January 2024; GDP-adjusted.
Using The Economist’s Big Mac Index, which compares the cost of McDonald’s signature hamburger in different countries to measure purchasing power parity, you can starkly see the weakened yen to the US dollar. Although this could persist, it appears highly anomalous that the currency of the world's fourth-largest economy is trading at such a disparity.
03. Corporate reform: quick fix for corporate inefficiency?
Renewed efforts by Japan’s larger companies to adopt business reforms that prioritise shareholder value and increase board independence, among other steps, have provided another stimulus to the cyclical ones mentioned above.
Corporate governance reform clearly provides a rising tide event for Japan and merits celebration. However, as with previous attempts under prime ministers Koizumi and Abe, investors should refrain from rallying around policy-induced initiatives in the hope they provide a quick fix to misaligned and poorly managed businesses. What is important is the direction of travel, which continues to progress thanks to several years of actioned initiatives.
Shareholder returns: dividends and buybacks
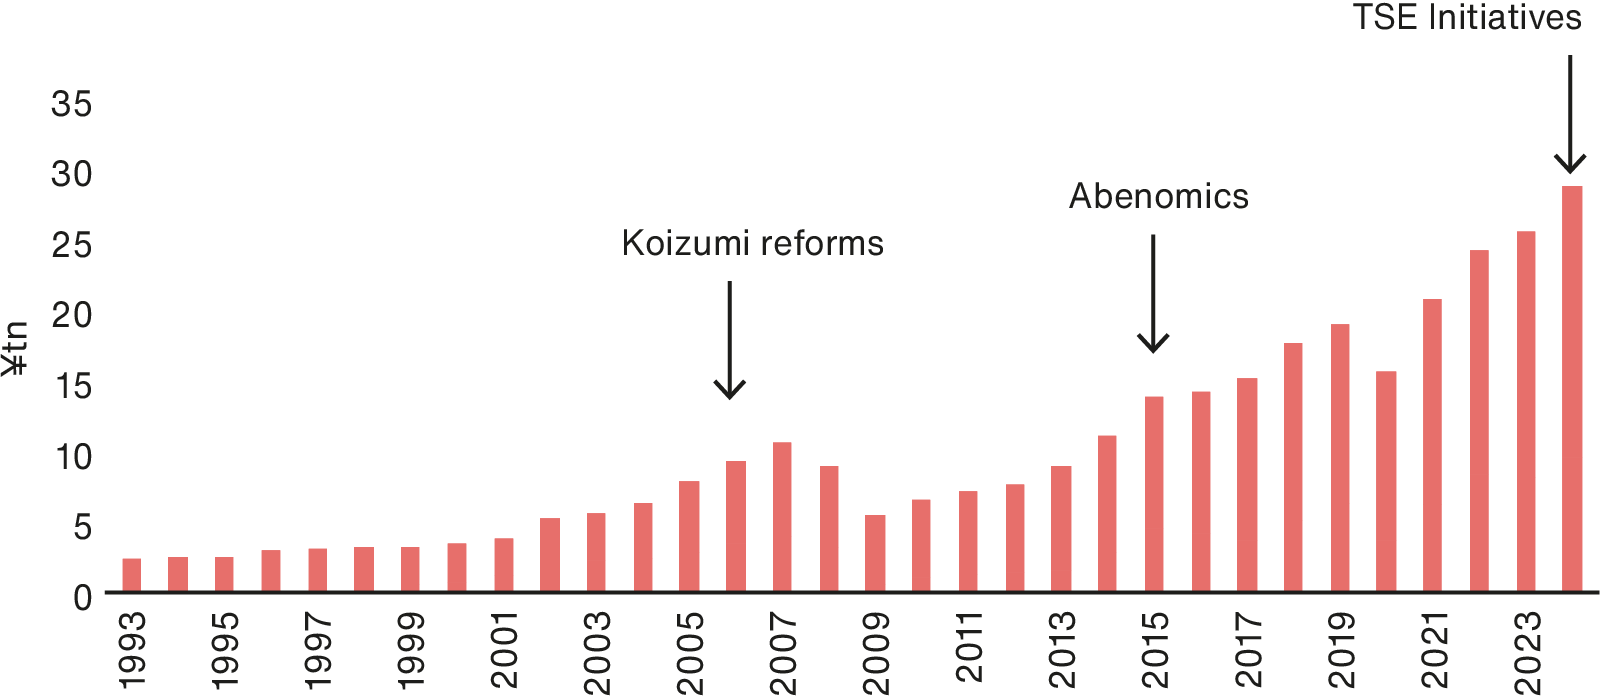
Source: Nomura. As at April 2024.
One area where this is evident is the banking sector. Many lenders now trade on price-to-earnings multiples on a par with western peers and well above their long-term averages, suggesting other investors believe they have strong prospects.
Yet extensive cross-shareholdings point to the need for further reform. By having large stakes in their corporate clients, in addition to each other, the lenders face criticism for shielding the management of underperforming businesses, preventing takeovers and tying up capital inefficiently.
We’re also mindful that they face other structural impediments, including Japan’s oversupply of banks, their significant overhead costs and the fact they offer commoditised services vulnerable to the challenge of more nimble online entrants.
Price-to-book multiplies for Japan’s megabanks
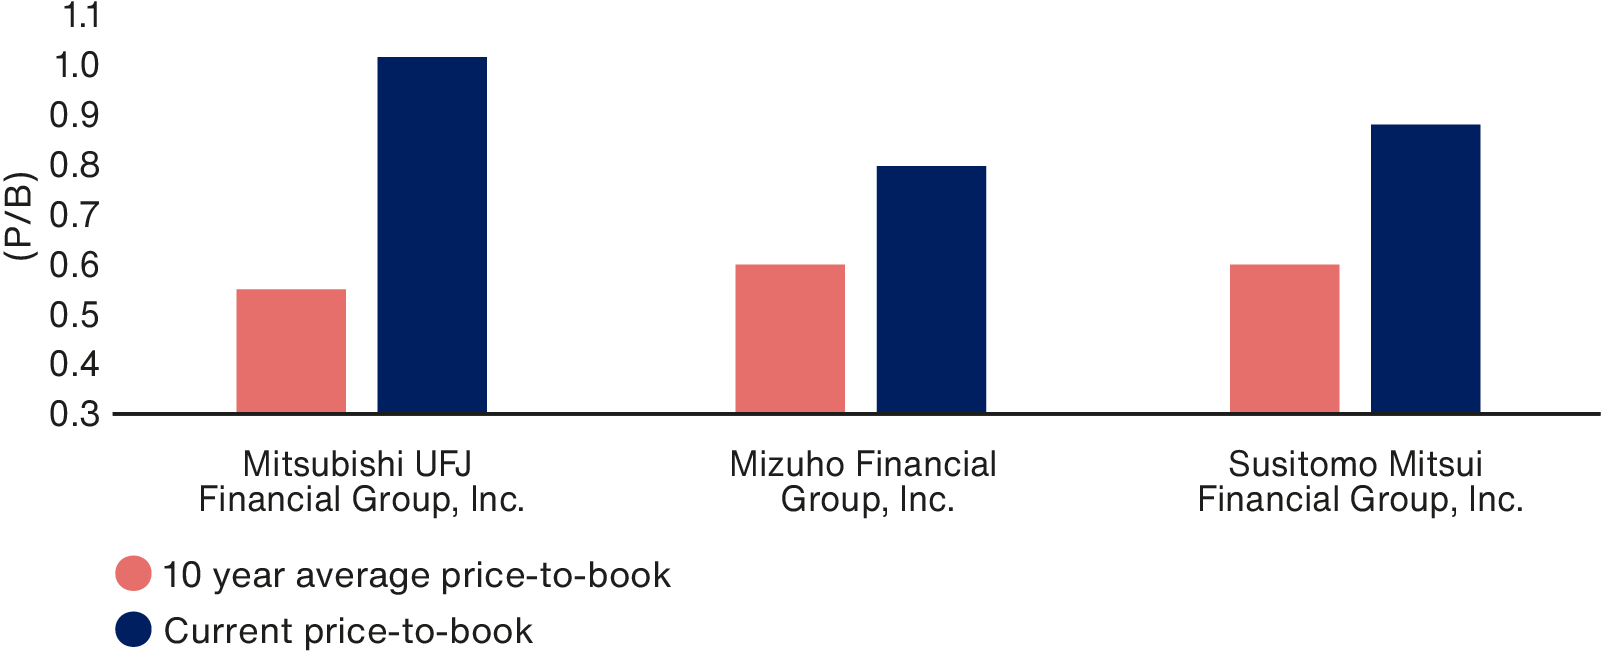
Source: Japan Exchange Group. As at 28 May 2024.
Putting these prospects into (portfolio) perspective
There appear to be two diverging sets of investment opportunities in Japan. At one end is a benchmark index populated with cyclical constituents – automobiles, banks and resources – that have been bid up on the back of favourable but arguably fleeting market conditions. At the other is a portfolio filled with stocks at the vanguard of various structural growth trends, now showing strong signs of sustainable operational progress yet no longer priced at a premium.
In our opinion, this imbalance is anomalous and likely to be corrected. Indeed, improvements in the performance of the growth companies we focus on and independent forecasts of further gains support this thesis.
Our portfolios aim to combine unique growth opportunities, each with the potential to outperform the market. They have consistently achieved this goal, despite the recent backdrop of higher inflation. The graphs that follow illustrate the performance of our Japanese Fund but are indicative of the Baillie Gifford Japan Trust and our Japanese Income Growth Fund.
Difference between delivered annual sales growth of companies in Japanese Fund v TOPIX
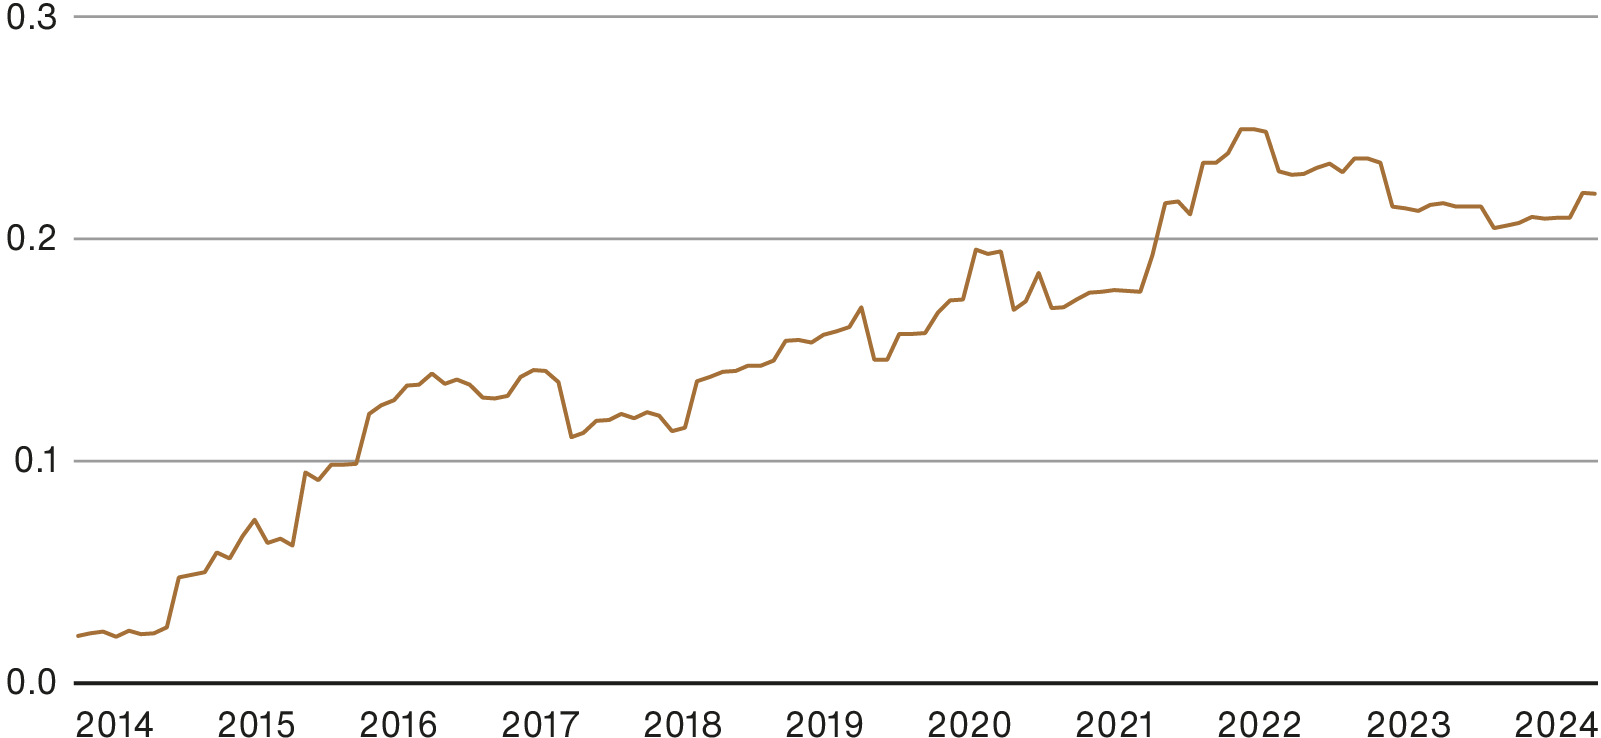
Source: Baillie Gifford & Co, Japan Exchange Group. As at 31 March 2024. Yen. Based on Japanese Fund v TOPIX index.
As the graphic above illustrates, our holdings have experienced faster sales growth than the market average over the past decade. Looking forward, most financial experts suggest that this growth gap is likely to expand at its fastest rate in 10 years. This adds further weight to our thesis beyond our investment team’s conviction.
Difference between the three-year projected sales growth of Japanese Fund companies v TOPIX
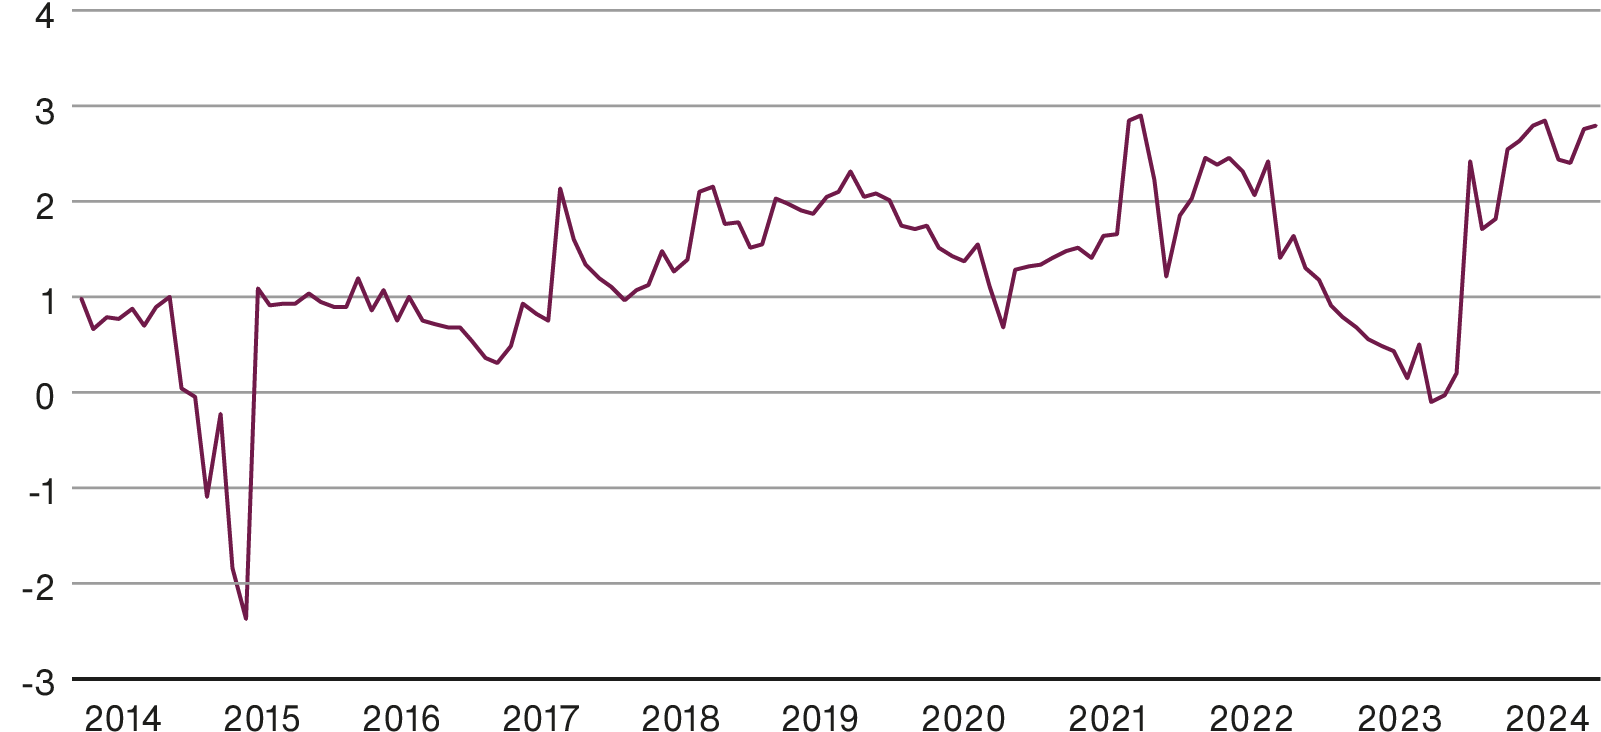
Source: Baillie Gifford & Co, Japan Exchange Group. As at 31 March 2024. Yen. Based on a Japanese Fund v TOPIX index. Three year forward sales growth spread. Forward sales growth excludes negative earnings. Log scale.
The bottom line also reflects this. We anticipate the Japanese Fund to deliver far greater earnings growth than the market (on both a one- and three-year basis) – recovering after an unusual two-year period of relative returns in which the benchmark TOPIX index benefited from the hard cyclical rally previously discussed.
Difference in the three and one year earnings-per-share growth of companies in Japanese Fund v TOPIX
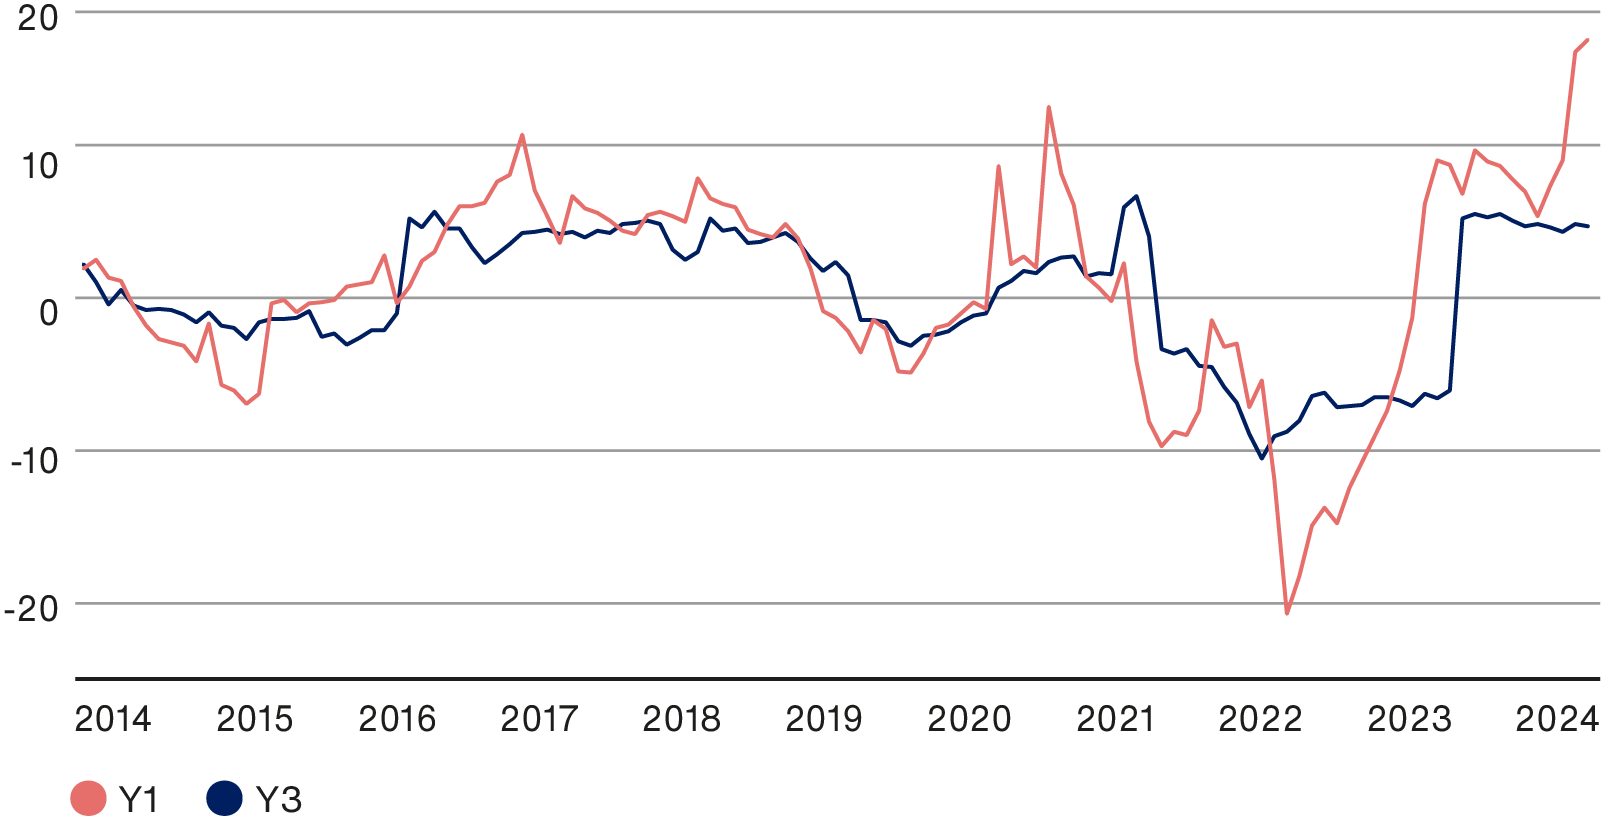
Source: Baillie Gifford & Co, Japan Exchange Group. As at 31 March 2024. Yen. Based on a representative Japanese Fund v TOPIX index. One and three year forward earnings growth spread. Forward earnings growth excludes negative earnings.
Conclusion
“Past performance is no guarantee of future results.” Although that statement is peppered across all forms of financial literature, investors often fail to heed its advice and instead anchor their expectations to the recent past. That poses a particularly acute risk for Japanese equity investors right now. Some may be tempted to double down on cyclical stocks, assuming their drivers will endure. Others may flee the market, believing the best is now behind us.
We believe there is a third option that offers the greatest upside potential: a shift towards the several uncorrelated areas of the market exposed to structural growth trends where companies are now delivering sustainable operational earnings growth. As discussed, those areas include growing internet use, rising wealth within Asia and demographic-driven healthcare spending.
Although the market has broadly overlooked them, their drivers are not only accelerating, but they are also becoming conspicuous parts of our everyday lives.
Our ability to identify and back such businesses is a product of our pedigree – 40 years of managing Japanese investments– and our patient long-term approach, seeking to hold stocks for at least five years versus the 20-month average time horizon of other asset managers. These factors offer us privileged insight and a greater perspective on navigating these cycles and calibrating our expectations. This approach allows us to back only the companies we believe will persist and emerge fitter for the future. This time is no different.
1Keyence is not held in the Baillie Gifford Japanese Income Growth Fund
|
|
2020 |
2021 |
2022 |
2023 |
2024 |
|
Baillie Gifford Japanese Fund (Class B Accumulation) |
4.7 |
18.0 |
-18.7 |
6.1 |
6.0 |
|
Baillie Gifford Japanese Income Growth Fund (Class B Income) |
1.8 |
13.8 |
-12.1 |
5.3 |
6.5 |
|
TOPIX Index |
6.1 |
10.7 |
-8.4 |
12.9 |
13.5 |
|
Baillie Gifford Japanese Fund Target* |
7.7 |
12.4 |
-7.0 |
14.6 |
15.2 |
|
Baillie Gifford Japanese Income Growth Fund Target** |
7.1 |
11.8 |
-7.5 |
14.0 |
14.6 |
|
|
1 year |
5 years |
10 years |
|
Baillie Gifford Japanese Fund (Class B Accumulation) |
6.0 |
2.5 |
8.5 |
|
Baillie Gifford Japanese Income Growth Fund (Class B Income) |
6.5 |
2.7 |
- |
|
TOPIX Index |
13.5 |
6.6 |
9.0 |
|
Baillie Gifford Japanese Fund Target* |
15.2 |
8.2 |
10.7 |
|
Baillie Gifford Japanese Income Growth Fund Target** |
14.6 |
7.7 |
- |
Past performance is not a guide to future returns.
Source: FE, Revolution, Japan Exchange Group. Total return net of charges, in sterling.
Share class returns calculated using 10am prices, while the Index is calculated close-to-close.
* TOPIX (in sterling) plus at least 1.5% per annum over rolling five-year periods.
** TOPIX (in sterling) plus at least 1% per annum over rolling five-year periods (through a combination of income and capital growth).
Baillie Gifford Japanese Income Growth Fund launched 04 July 2016.
Legal notice: The TOPIX Index Value and the TOPIX Marks are subject to the proprietary rights owned by Tokyo Stock Exchange, Inc. and Tokyo Stock Exchange, Inc. owns all rights and know-how relating to the TOPIX such as calculation, publication and use of the TOPIX Index Value and relating to the TOPIX Marks. No Product is in any way sponsored, endorsed or promoted by Tokyo Stock Exchange, Inc.
Risk factors
This communication was produced and approved in July 2024 and has not been updated subsequently. It represents views held at the time of writing and may not reflect current thinking.
This article does not constitute, and is not subject to the protections afforded to, independent research. Baillie Gifford and its staff may have dealt in the investments concerned. The views expressed are not statements of fact and should not be considered as advice or a recommendation to buy, sell or hold a particular investment.
Potential for profit and loss
All information is sourced from Baillie Gifford & Co and is current unless otherwise stated.
The images used in this communication are for illustrative purposes only.
Important information
This communication contains information on investments which does not constitute independent research. Accordingly, it is not subject to the protections afforded to independent research, and Baillie Gifford and its staff may have dealt in the investments concerned.
The Fund’s share price can be volatile due to movements in the prices of the underlying holdings and the basis on which the Fund is priced.
Investments with exposure to overseas securities can be affected by changing stock market conditions and currency exchange rates. Exposure to a single market and currency could increase risk.
Baillie Gifford & Co and Baillie Gifford & Co Limited are authorised and regulated by the Financial Conduct Authority (FCA). Baillie Gifford & Co Limited is an Authorised Corporate Director of OEICs.
Further details of the risks associated with investing in the Fund can be found in the Key Investor Information Document, copies of which are available at www.bailliegifford.com, or the Prospectus which is available by calling the ACD.
Custody of assets involves a risk of loss if a custodian becomes insolvent or breaches duties of care.
112608 10049002