

Investors should carefully consider the objectives, risks, charges and expenses of the Fund before investing. This information and other information about the Fund can be found in the prospectus and summary prospectus. For a prospectus or summary prospectus please visit our website at https://usmutualfund.bailliegifford.com. Please carefully read the Fund’s prospectus and related documents before investing. Securities are offered through Baillie Gifford Funds Services LLC, an affiliate of Baillie Gifford Overseas Limited and a member of FINRA.
Never knowin’ if believin’ is a blessin’ or a curse Or if the goin’ up was worth the comin’ down.
We have spent much of the past three years discussing whether, as the song goes, the goin’ up was worth the comin’ down. Based on the year just ended, the good news is that the comin’ down seems to have stopped for now, with the portfolio achieving good absolute returns and outperforming its benchmark. One year is an artificially short period, of course, though a helpful marker.
But that recovery doesn’t remove the need for us to reflect on a period of uncomfortably volatile investment outcomes, illustrated in the chart below.
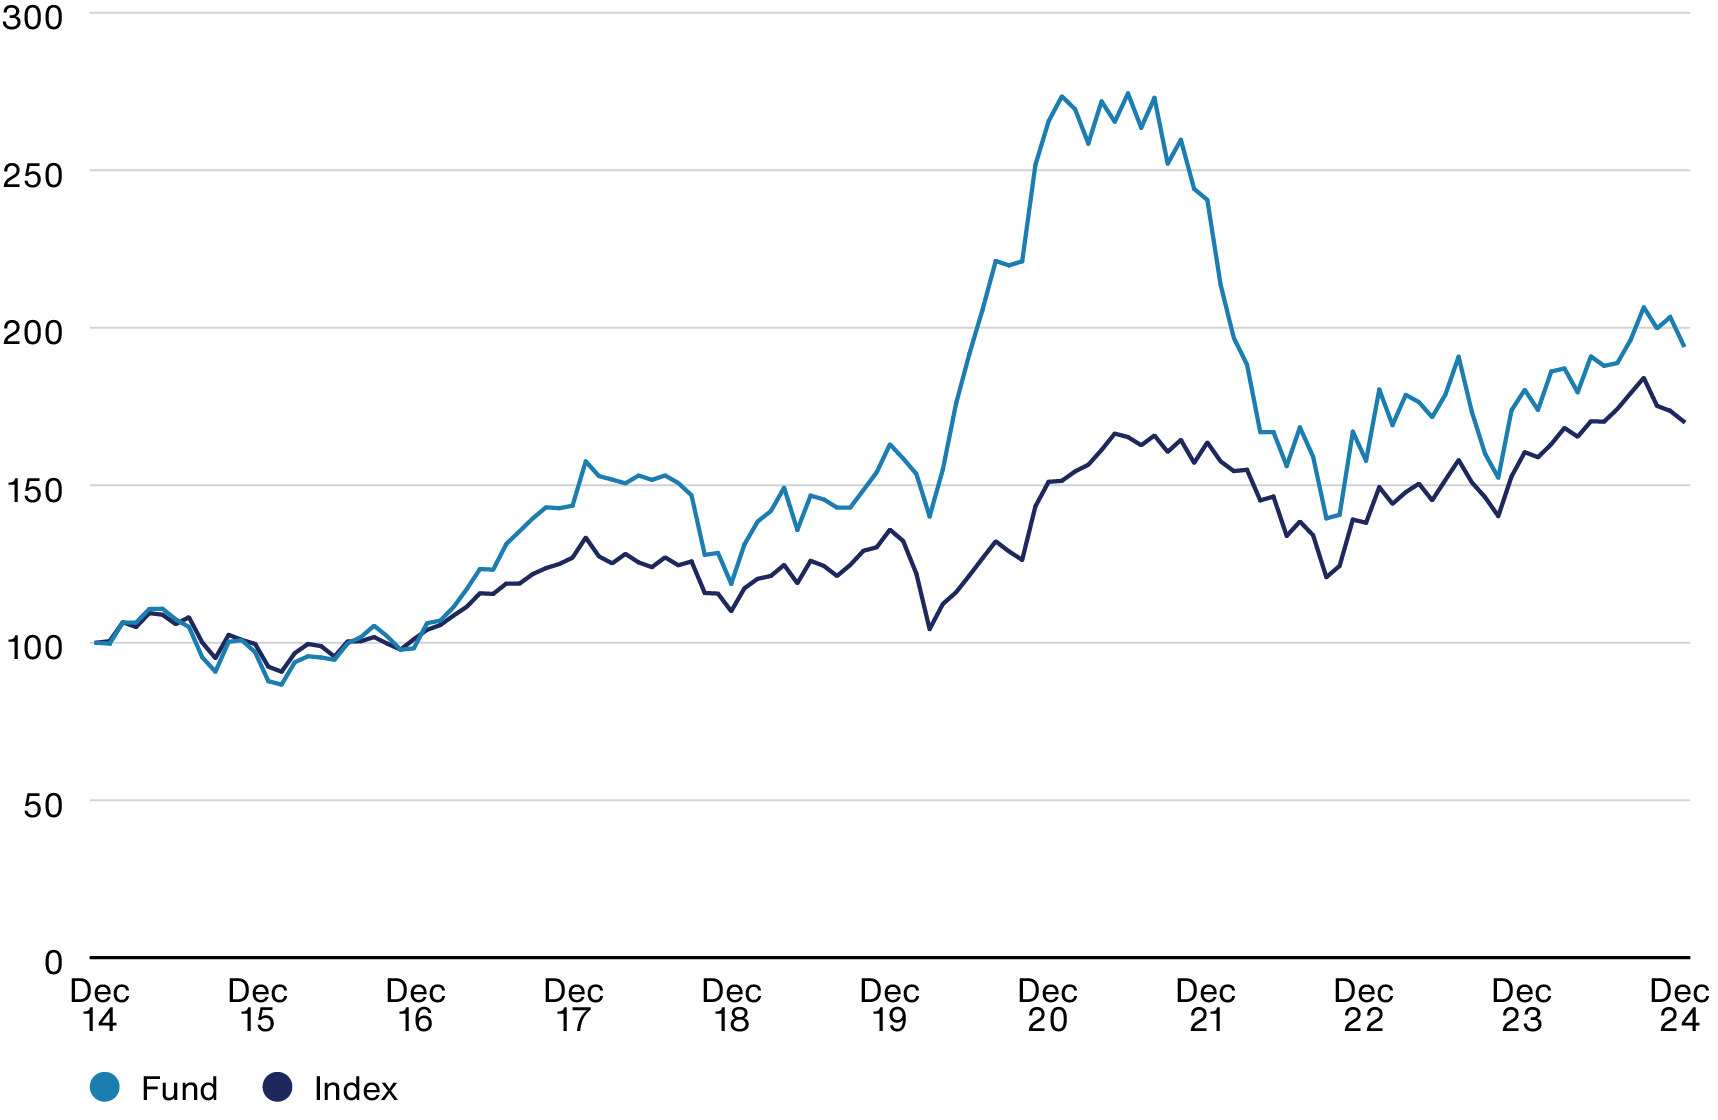
Source: Revolution, MSCI. As at December 31 2024. US dollar. Based on International Growth Fund.
Index: MSCI ACWI ex USA Index, prior to 11/22/2019 MSCI EAFE Index. Rebased to 100.
Our first reflection, or lesson, is that we became too narrow in the types of companies we owned and researched on our client’s behalf.
We were right in identifying the transformational power of digital technology. We were right in recognising the pivotal role that China would play in the global economy. And our push in the early 2010s to embrace the potential of highly uncertain outlier investments, and to move away from generally-recognised ‘growth-at-a-reasonable-price’ stocks was also correct. These views have been critical in delivering good long-term returns for clients, rooted in our patient ownership of companies like ASML, MercadoLibre, Spotify and Tencent.
But in following these insights we became like Charlie Munger’s man with a hammer, to whom everything looks like a nail. Again, this is simplified somewhat, but I’ll give three examples to illustrate:
(i) Being too optimistic about the growth potential of certain companies
While some technology businesses are able to attain a very high market share in a winner-takes-all manner (think of the products that Alphabet, Meta or Microsoft sell), others are more bounded by the nature of their market. This is particularly true when they are selling physical goods. Companies like Zalando, in online clothing, or HelloFresh, in meal kits, grew very rapidly for a while. But just as pandemic-era demand drove a structural increase in the market opportunity for some companies, for others it accelerated their growth towards a mature endpoint. Zalando and HelloFresh fall into this category. Zalando made a negligible impact on the portfolio’s performance last year and HelloFresh detracted from returns. Both have now been sold.
We will always have growth businesses that fail to meet our more ambitious expectations of them: if we don’t, we’re not being imaginative enough. But in the case of some of those companies where maturity arrived sooner than we’d expected, we allowed the holding size to become too large.
(ii) Focusing too much on growth and not enough on underlying business economics
Companies like Nidec, Umicore or Vestas all face large growth opportunities, but they operate in industries that are capital-intensive and highly competitive. In such cases, we put too much weight in our analysis on the growth opportunity and not enough on the business quality and financial outputs. We have sold some of these (Nidec in the most recent quarter), and those that remain have a final chance to show that their growth potential is sufficient to transform the current economics of their businesses.
(iii) Too little time searching for super-high-quality growth compounders
We have held L’Oréal in the portfolio since the inception of the Fund in 2008. And the key reason for us taking a holding in Fiat Chrysler was because it owned Ferrari, which was then spun out to shareholders in 2016. Identifying these exceptional quality growth companies and owning them despite high near-term valuations is well within our circle of competence. But in our search for disruptive, technology-enabled rapid growth companies we spent too little time looking for the next Ferrari. Even if, like Hermès, it had been around since 1837.
Our categorisation of the portfolio into ‘Adaptors’ and ‘Disruptors’ was also unhelpful in this regard, a distinction we’ve now dropped. While ‘Disruptors’ was a good shorthand for the type of innovative growth companies we seek, ‘Adaptors’ wasn’t a precise enough articulation of the appeal of businesses like Ferrari, L’Oréal or Atlas Copco. A better description is that they are just extremely high-quality across multiple dimensions, including competitive advantage, customer loyalty, operational execution, firm culture and stewardship. These lead to compelling financial outputs: margins, cashflows and returns. And the best of them – those that interest us – can reinvest and grow.
Over the last two years, we have broadened our research funnel so that we are looking at a greater variety of growth companies. But our hurdle for inclusion in the portfolio remains high. The trick is to broaden our inputs while keeping the bar high on the quality of business and growth potential. We believe the new holdings we have taken – the likes of Advantest, DSV, Hermès, and Novo Nordisk – achieve that balance and have improved the portfolio.
Our second main lesson is the importance of striking the right balance between stock picking and portfolio construction.
We are bottom-up investors who emphasise rapid growth, cultural advantage and the importance of outliers. We pay little attention to the index. These are key tenets of how we invest for clients. But pushed too far they can lead to a portfolio where thematic concentrations rather than individual holdings become disproportionately influential in driving returns.
There is no silver bullet to risk management. The measures we are familiar with from academic work are flawed by their inevitable reliance on historic data and the problem of residuals (you measure what can be measured and lump together the rest, however inaccurate that may be).
But while there’s no single quantitative measure, it is critical to ensure that risk management is an integrated part of the investment process, and with that in mind, we are now making better use of data analytics in our portfolio construction. I’ll highlight three significant steps we’ve taken:
(i) Introducing a fortnightly Implementation Meeting, at which the three core members of the Portfolio Construction Group (PCG) – Lawrence Burns, Robert Wilson and Tom Coutts – ensure recommendations from our most recent stock meetings are implemented. These discussions used to happen ‘around the desk’, but we have found a more structured approach additive to our process. This group acts on the enthusiasms and preferences of the whole PCG and is responsible for deciding holding sizes, sources of funds, and the speed with which positions are bought or sold. The group also oversees our research agenda.
(ii) Working closely with an IT data analyst to bring relevant data closer to the portfolio construction process.
(iii) Developing a dashboard to help us monitor the overall shape of the portfolio. Again, recognising the fact that there is no single measure to focus on, the dashboard allows us to look at the portfolio through a range of lenses to ensure that we are backing our convictions while not allowing it to become too thematically driven.
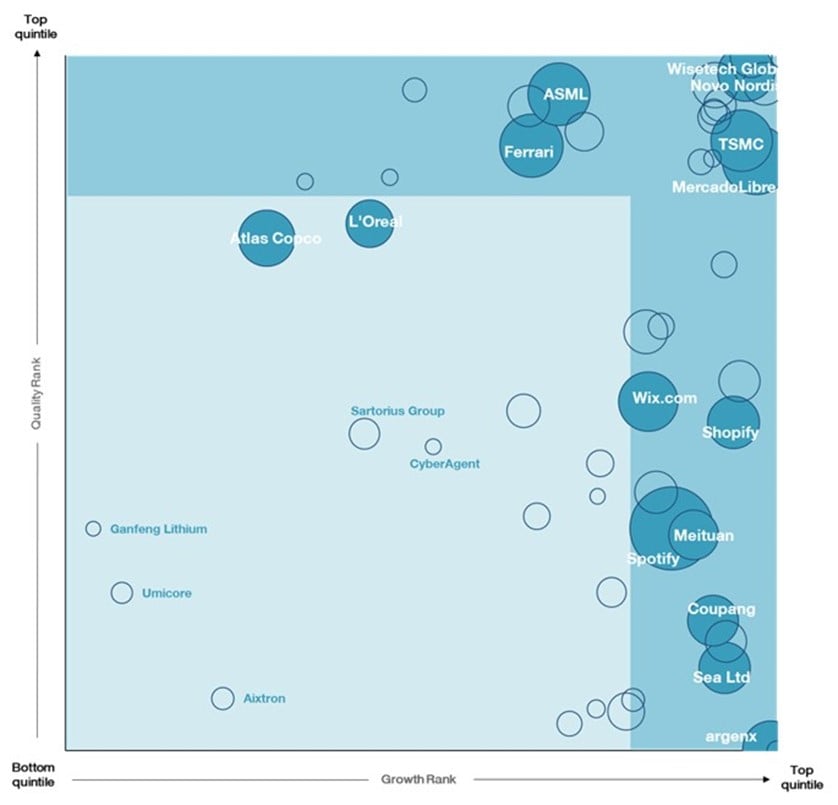
Some of these measures are relatively straightforward – performance, tracking error, turnover, industry and country weight, valuations, etc. Perhaps most useful is our growth / quality screen, which maps the portfolio on two axes – three-year forecast sales growth and free-cash-flow margin. We expect holdings either to be very high-growth or very high-quality – ideally both – and this gives a good overall picture of the portfolio as well as allows us to zoom in on individual companies that are doing better or worse than expected.
None of this is rocket science. We have always considered these measures. Our Risk team regularly presented portfolio data to us, but we can get better at using the available tools more systematically, and at developing our own thinking about portfolio construction and risk in a more deliberate manner. The critical first step is to bring better data analytical tools closer to our decision-making process. The end goal is to deliver attractive long-term investment returns with the portfolio sufficiently diversified by type of growth and using an appropriate portion of our clients’ risk budgets.
What did work well?
We strongly believe that our focus on bottom-up, long-term, outlier-seeking, capital-G Growth investing is what our clients expect of us. And with the steps outlined above, we believe we are well-placed to keep delivering good long-term investment outcomes.
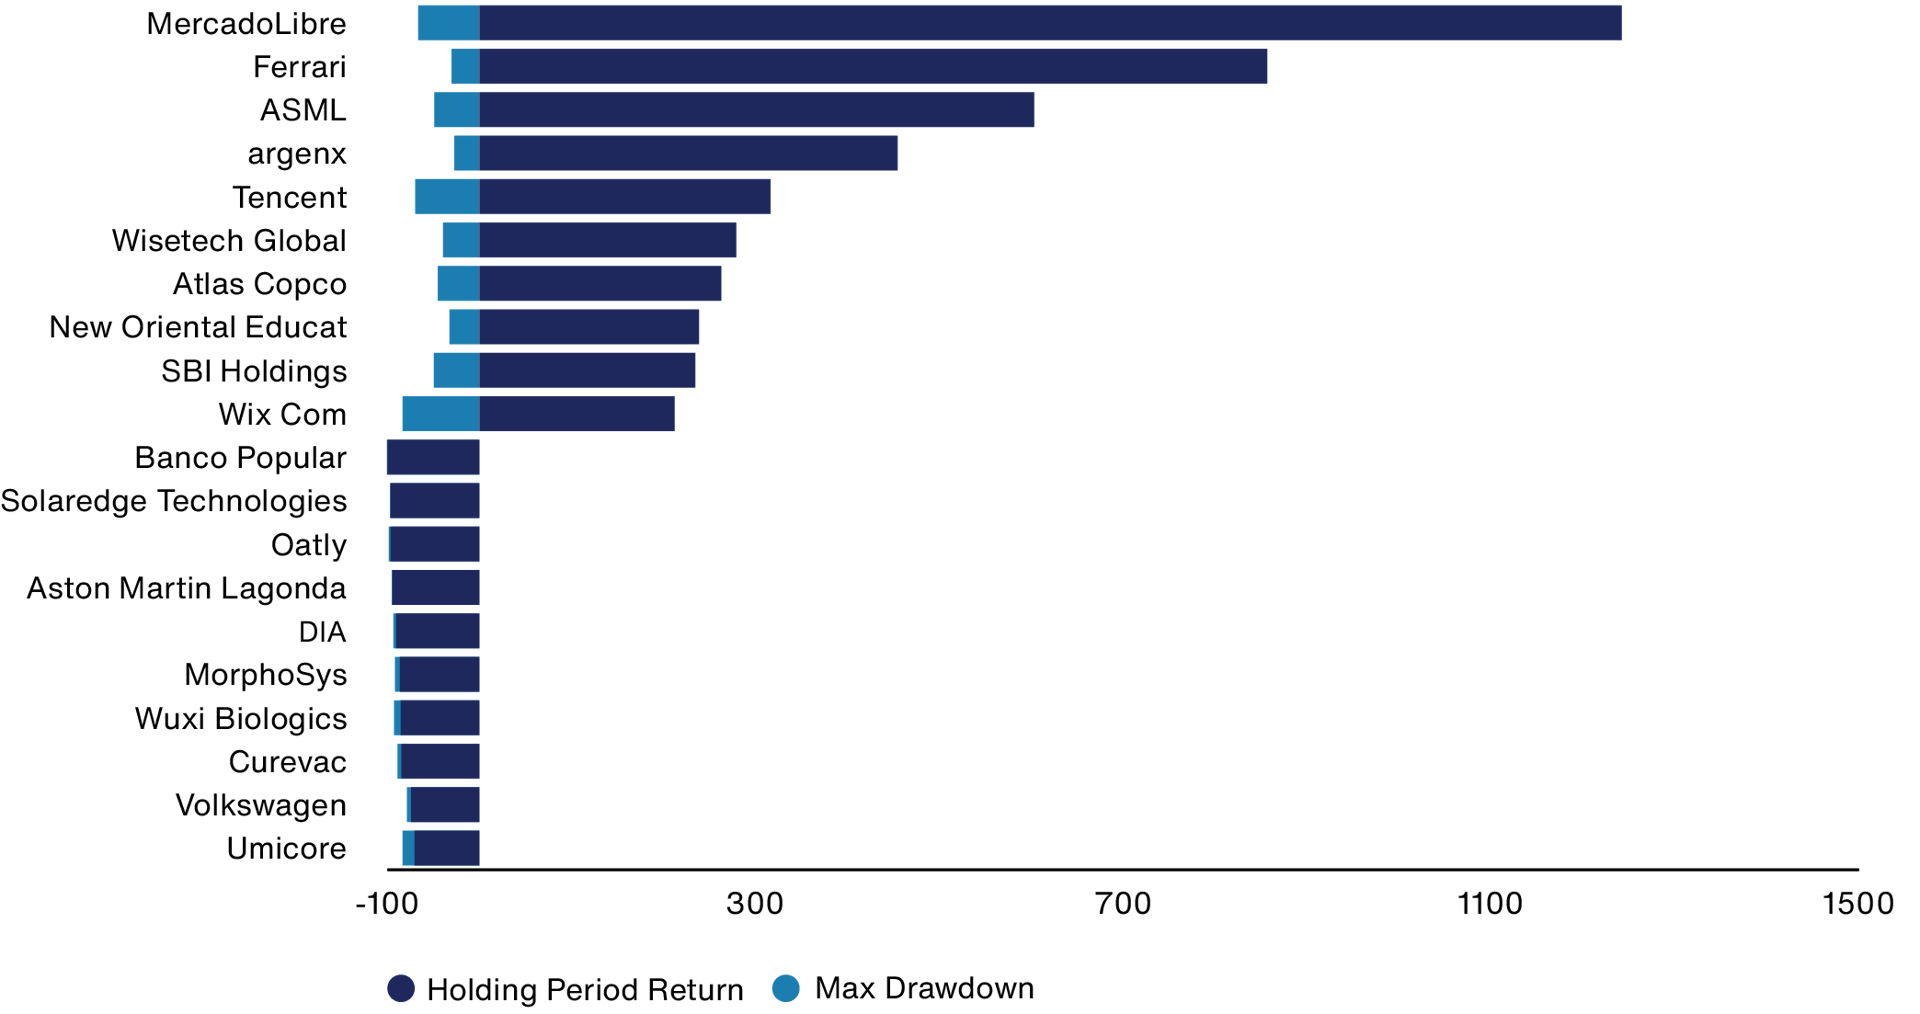
Source: Revolution. Based on International Growth Fund. US dollar
Data based on 10 years to December 31 2024.
Some stocks were only held for part of the period. Past performance is not a guide to future returns.
We have deliberately been patient during this period of volatile performance. I recall sitting on a train from Philadelphia to New York in the summer of 2022 with Lawrence and Nick from our Portfolio Construction Group and deciding that while we should be very active in reflecting on what had worked, and what had not worked, we should be patient in drawing firm conclusions and making process changes. We agreed that five years after the start of the pandemic would be an appropriate time – which takes us to the end of 2024, today.
Patience is critical to how we invest – holding on to Spotify despite the share price volatility over the last few years highlights the rewards from being patient. It is one of the top contributors to performance over the past year. Our partnership structure puts us in a good position to invest in that way. But our firm structure is a necessary condition for patience, not a sufficient one. Under pressure, time horizons compress, and it is tempting to look for short-term gains just to stop the pain of poor performance and client (and colleague) pressure.
When I look at International Growth, and across our strategies at Baillie Gifford, I do not see that behaviour today. Our portfolio turnover has been slightly higher in 2024, as we have moved on from some investments and initiated new positions, but we would expect to settle back into our 10-20 per cent corridor. Over the last few years, there has been a deliberateness: a balance of patience – particularly when allowing companies time to adapt and evolve – and urgency in reflecting on our own processes.
A restatement of our aims and process
It’s important to close with a restatement of what we do and how we do it.
We are long-term owners of exceptional growth companies, as we believe this to be the best way to deliver good returns to our clients. Long-term owners because of the competitive advantage that our firm structure allows us. And exceptional growth companies because historic data shows how few companies really matter in driving long-term investment returns. From ASML in semiconductors, to Argenx in healthcare, to WiseTech and Wix.com in software, it is exceptional companies driving economic progress that earn the right to create large amounts of shareholder value in a sustainable manner. To be good owners of these companies requires us to be patient and optimistic.
We believe change and disruption driven by technological progress are the norm, and that change happens – per Hemingway – ‘gradually then suddenly’. The sudden change grabs the headlines, but the gradual change is often more important. Volkswagen’s recent proposal to close factories in Germany for the first time in its 87-year history is sudden, but the pressure from the electric vehicle transition has been building for a while and will only continue. Some of our companies will see spectacular change, and grow very rapidly. Others will compound away at high rates of return over many years. Both types of companies need to embrace change.
We invest in uncertainty. Documents like this make the past seem simpler than it was. Life is lived forwards, and ‘lessons learned’ are always contingent. We try hard to separate inputs from outputs, but the outputs – share prices – necessarily colour the inputs and determine perceptions of success.
We believe culture matters. Both our own and those of the companies we invest in. There is no perfect corporate culture, but every organisation must create behaviours and incentives, and arrange itself, in the way best suited to its task.
We believe the international universe offers compelling investment opportunities over the coming years. The shift to a multipolar world is well underway, technological innovation will continue – in generative AI and other realms – and consumers, whether in young, fast-growing countries, or older, more mature ones, will continue to demand high-quality goods and services. Our portfolio of Growth companies is well-placed to address such trends, and we will keep seeking new opportunities.
Concluding thoughts, inspired by wisdom from outside the financial world
In writing this piece looking back at mistakes made and lessons learned I am reminded of the words of the French mathematician and Fields Medal winner Cédric Villani, who visited our offices a few years ago. He describes how the open exchange of ideas needed to push forward the frontier of mathematical knowledge requires “the willingness to risk the embarrassment of appearing less than brilliant”. But he goes on to emphasise that “this is the price of making progress on a difficult problem”. The task of investing is a difficult problem. And we undertake that task in partnership with our clients who deserve an honest self-assessment of how we have performed, even if in providing such reflections we appear less than brilliant.
Villani also describes himself as “a pathological optimist”. Clients won’t be surprised to hear that this description resonates strongly with us. We have to balance the honest assessment of mistakes with the relentless search for future growth companies, imbued with a spirit of optimism and a focus on asking “what if it really works?”
I mentioned Spotify earlier. A colleague’s note from March 2018 outlined, as our work does, Bear, Base, Bull and Blue Sky performance scenarios. At the time of writing in late 2024, Spotify’s market capitalisation of $95bn is exactly halfway between the Bull and Blue Sky scenarios. For a while, Spotify was a ‘pandemic winner-turned-loser’, with its shares rising strongly in 2020 and then collapsing. But the share price today is now a third higher than the pandemic peak, and more than six times greater than the lows of late 2022.
As Spotify illustrates, rational optimism rooted in a clear understanding of a company’s fundamentals, a willingness to take risks – including the risk of embarrassment – and a supportive environment for patient investing are central to our ability to deliver good investment outcomes for our clients. We are frank in confronting our mistakes, relentless in our pursuit of getting better, and enthusiastic about our team, our processes and the investment portfolio. Even more than usual, we are deeply aware of our good fortune in having such a high-quality client base, and greatly appreciate our client’s support and constructive challenge.
Risk Factors
This content contains information on investments which does not constitute independent research. Accordingly, it is not subject to the protections afforded to independent research and Baillie Gifford and its staff may have dealt in the investments concerned.
As with all mutual funds, the value of an investment in the fund could decline, so you could lose money.
The fund is distributed by Baillie Gifford Funds Services LLC. Baillie Gifford Funds Services LLC is registered as a broker-dealer with the SEC, a member of FINRA and is an affiliate of Baillie Gifford Overseas Limited.
The images used in this article are for illustrative purposes only.
(Share Class K) as of 31 December, 2024
| Gross Expense Ratio | 0.58% |
| Net Expense Ratio | 0.58% |
Annualised total return as of 31 December, 2024 (%)
| 1 Year | 3 Years | 5 Years | 10 Years | |
| The Baillie Gifford International Growth Fund | 7.84 | -6.84 | 3.60 | 6.88 |
| MSCI ACWI ex US Index* | 6.09 | 1.35 | 4.60 | 5.46 |
*MSCI EAFE until 11/22/2019, MSCI AC World ex US thereafter.
Source: Baillie Gifford & Co, Bank of New York Mellon, MSCI. Share Class launch date: March 06, 2008. Net of fees, US dollars.
The performance data quoted represents past performance and is no guarantee of future results. Investment return and principal value of an investment will fluctuate so that an investor’s shares, when redeemed, may be worth more or less than their original cost. Current performance may be lower or higher than the performance data quoted. For the most recent month-end performance please visit our website at www.bailliegifford.com/usmutualfund/internationalgrowthfund
Returns are based on the K share class from 28 April 2017. Prior to that date returns are calculated based on the oldest share class of the Fund adjusted to reflect the K share class fees where these fees are higher.
The Baillie Gifford fund’s performance shown assumes the reinvestment of dividend and capital gain distributions and is net of management fees and expenses. Returns for periods less than one year are not annualised. From time to time, certain fees and/or expenses have been voluntarily or contractually waived or reimbursed, which has resulted in higher returns. Without these waivers or reimbursements, the returns would have been lower. Voluntary waivers or reimbursements may be applied or discontinued at any time without notice. Only the Board of Trustees may modify or terminate contractual fee waivers or expense reimbursements. Fees and expenses apply to a continued investment in the funds. All fees are described in each fund’s current prospectus.
Expense Ratios: All mutual funds have expense ratios which represent what shareholders pay for operating expenses and management fees. Expense ratios are expressed as an annualized percentage of a fund’s average net assets paid out in expenses. Expense ratio information is as of the fund’s current prospectus, as revised and supplemented from time to time.
The MSCI All Country World ex US Index is a free float-adjusted market capitalization weighted index that is designed to measure equity market performance in the global developed and emerging markets, excluding the United States. This unmanaged index does not reflect fees and expenses and is not available for direct investment. The Fund is more concentrated than the MSCI ACWI ex US Index.
Top Ten Holdings
| Holdings | Fund % |
|---|---|
| 1. Spotify | 7.00 |
| 2. TSMC | 5.45 |
| 3. MercadoLibre | 4.61 |
| 4. Adyen | 4.60 |
| 5. ASML | 4.46 |
| 6. Ferrari | 4.44 |
| 7. Wix.com | 3.63 |
| 8. argenx | 3.44 |
| 9. Atlas Copco | 3.41 |
| 10. WiseTech Global | 3.27 |
Data as of 31 December 2024.
It should not be assumed that recommendations/transactions made in the future will be profitable or will equal performance of the securities mentioned. A full list of holdings is available on request. The composition of the fund's holdings is subject to change. Percentages are based on securities at market value.
Legal Notices
Source: MSCI. MSCI makes no express or implied warranties or representations and shall have no liability whatsoever with respect to any MSCI data contained herein. The MSCI data may not be further redistributed or used as a basis for other indexes or any securities or financial products. This report is not approved, endorsed, reviewed or produced by MSCI. None of the MSCI data is intended to constitute investment advice or a recommendation to make (or refrain from making) any kind of investment decision and may not be relied on as such.
139217 10052953