As with any investment, your capital is at risk.
Conventional financial theory has it that, in the long term, shares in smaller businesses outperform those in larger businesses — the so-called small cap premium.
But in the last decade, larger businesses have trounced smaller ones, especially in the US, where they’ve outperformed small caps by 140 per cent.
What happened to that premium?
Perception vs reality
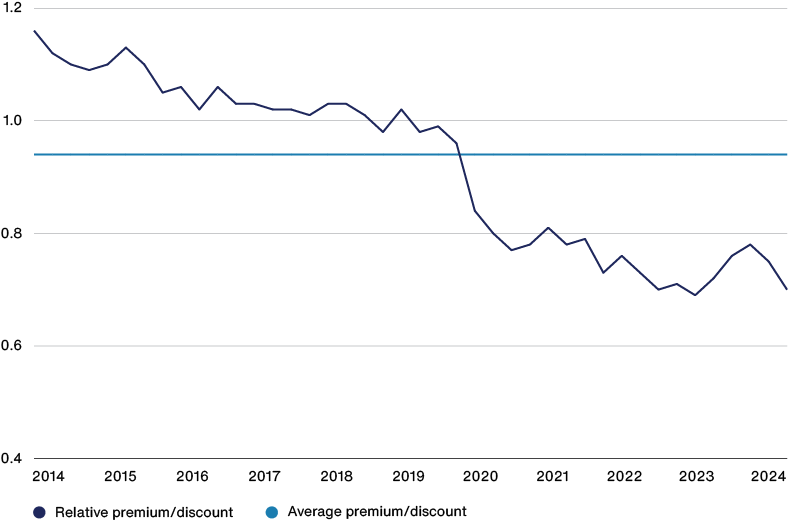
Recent underperformance has largely been driven by indiscriminate derating of valuations, rather than problems with small cap companies themselves. Investors are now less willing than five years ago to pay for small cap earnings. Small cap investors have suffered as a result.
Price to earnings ratio of small cap class relative to large cap

Source: FactSet, MSCI. Data 30 June 2014 to 30 June 2024. MSCI ACWI Small Cap vs MSCI ACWI Large Cap. US dollars. EMEIS Holdings has been excluded.
Now valuations are at their lowest levels relative to large caps since 2008, when the global financial crisis scared many investors out of the asset class. In the US they’re as low as they were in 1999, another time when there were a few highly valued IT names and intense concentration in large cap indices. A decade of stellar returns followed the turn of the millennium.
What’s driven this recent underperformance? First, interest rates. Small caps need more external capital and they’re more exposed to rate changes. Their prices tend to be more sensitive, given that expected cashflows lie further in the future. No wonder they’ve suffered from aggressive rate hikes.
Other narratives suggest deeper problems. They present small cap strife as not just a cyclical phenomenon, but as evidence of an asset class doomed to underperform its bigger equivalent. In this reading, the small cap premium is dead and buried.
The size of the pool
For some, the fact that there are fewer listed companies means the scope for outperformance is correspondingly less. Taking the US market as representative, there are now fewer listed businesses than there were 20 years ago. Increased market regulation and more available venture and private equity capital have encouraged companies to stay private for longer – or to delist.
This makes sense. We’ve been investing in private companies for almost a decade, seeking to ensure we don’t miss the disruptors of tomorrow.
But the correlation between volume and outperformance isn’t so simple. It’s the number of the smallest listed companies, the micro caps, that has reduced most. The number of stocks in our favoured small and mid-size category has stayed roughly the same.
This global market remains huge. Our benchmark S&P Global SmallCap index holds more than 11,000 companies, and there are tens of thousands beyond that. The pool may be shrinking, but it’s still much larger than the large cap universe, offering more than enough choice for a portfolio of around 100 stocks.
Only the best
The second argument against small caps is that they tend to be poor quality, with shaky balance sheets, inferior growth prospects, and lower profitability.
There is data to support this. On average, small caps do underperform larger businesses. Large caps have delivered better five-year earnings growth for each of the last five years.
But the term ‘on average’ is key. Yes, most smaller businesses are low quality. But that’s why we’re looking for the exceptional few capable of becoming much larger.
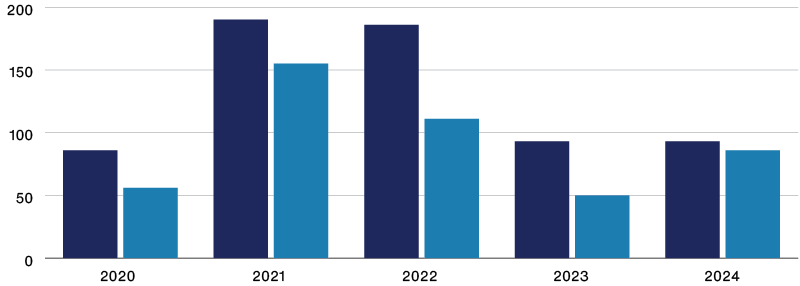
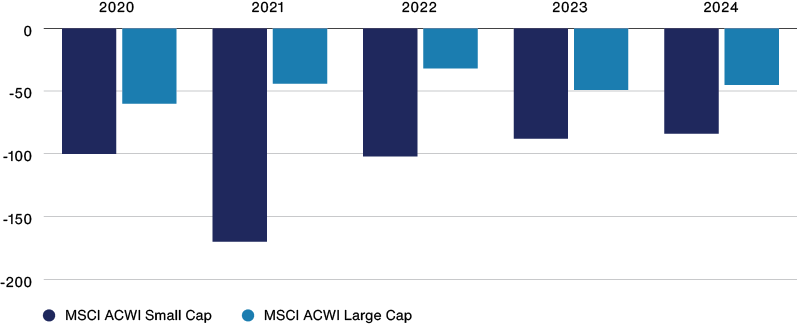
For our experienced team, the ‘average’ small cap is irrelevant. It’s the difference between the best and the worst that’s interesting. The fastest-growing smaller companies continually outperform the fastest-growing larger ones.
Top quintile earnings growth (%)

Bottom quintile earnings growth (%)

Source: FactSet, MSCI. US dollars. Data to 31 July each year. Based on 1yr earnings-per-share inc neg.
We believe the best way to find this exciting growth is through tried-and-tested active management that can filter for quality and potential, ignoring the junk.
Beyond scale benefits
Here’s another argument against small caps: in the digital age, the benefits of scale – data, compute, or storage – are clearer than ever. You only need to look at giants such as NVIDIA, Microsoft, Apple and Alphabet that are driving markets to new heights.
Again, we agree. There’s plenty of evidence for the scale advantage of big tech. An early realisation of this has been hugely beneficial to Baillie Gifford clients over the last decade.
But it doesn’t follow that, because the tech sector shows higher returns to scale, opportunities for disruptive innovation are dead. Far from it. In the 10 years that larger tech companies have dominated, small cap disruptors have still triumphed, seizing opportunities for exponential returns. Taking examples from our transformational holdings that began as small caps:
- DexCom (bought 2012, sold 2021) allowed diabetics to monitor their blood glucose on the go. Its focus and innovation provided the best product, tailored a sales operation and prioritised the amassing of clinical evidence to dominate the US market, outcompeting less focused competitors.
- Tesla (bought 2013, sold 2022) challenged incumbents suffering from the classic ‘innovators dilemma’. The entrenched processes of car makers made them wary of cannibalising their internal combustion model to invest in EVs. Tesla’s ‘first principles’ approach to design, manufacturing, automation and battery technology allowed it to seize the lead.
- Axon (bought 2018) brought disruptive innovation to a traditional area, cornering the market in Tasers, bodycams, and software for law enforcement, a market that competitors ignored. Its products have vastly improved efficiency.
In summary: we don’t deny the shrinking of the small cap universe, the poor quality of many small caps, or the benefits of scale.
But you shouldn’t confuse these factors with proof of an asset class in structural decline. We can equally point to a remaining deep pool of companies, some with incredible growth potential, which can challenge incumbents and win.
On the upside
The good news for our investors is that negative sentiment has lowered valuations, providing an incredible opportunity for long-term stock pickers.
Our strategy is to harness long-term equity asymmetry. We seek the special few that can sustain long-term high growth, delivering multiples of the initial investment. A good barometer for such companies is whether they can deliver a five-times return over five years.
Percentage of companies delivering 5x return

Number of companies delivering 5x return

Source: Baillie Gifford & Co, S&P. Base Rate Analysis. US dollars. Based on S&P 500. Data from 31 December 2003 to 31 December 2023.
We recently analysed the proportion of such companies in the US market over the last 20 years. For companies with a market cap between $300m and $10bn, there were 50 per cent more five-times returners than in the S&P 500. That’s a lot.
The difference is even starker when you look at the number of companies delivering a five-times return. Our investable universe produced almost nine times as many five-time returners as the S&P 500.
These outliers tend to be the areas with the most innovation. Technology and healthcare make up 45 per cent of five-times companies, with biotech, semiconductors, and software the highest represented industries.
So, in summary, the small-cap universe remains the place to look for future outliers that can become tomorrow’s tech champions.
Potential, not size
We search for immature greatness, not just small size. Market cap size tells you nothing about potential. We’re looking for four traits:
- Innovation directed at solving big problems
- A defensible competitive edge
- Visionary, high-quality management
- Returns that scale with growth
Companies with all four have a higher chance of delivering outsized returns.
What then do tomorrow’s disruptors look like? Experience has led us to some promising categories, including healthcare, digital infrastructure and transformative hardware. Here are some examples:

Healthcare revolution
Advances in genetic sequencing capabilities, combined with increased data processing power are ushering in a new era of preventative, personalised healthcare. The convergence is helping to transform patient outcomes for the better.
Example: Alnylam
A pioneer in this sector, Alnylam has created drugs that can ‘silence’ the faulty genes that cause diseases, a scalable platform that can be used for many targets. Industry-wide, only 6 per cent of drugs make it to market, but Alnylam has delivered more than 60 per cent, the highest returning model the industry has seen. Therapies for cardiovascular disease, Alzheimer’s and diabetes are in the pipeline.

Digital infrastructure
New AI-enabled digital tools and technologies imrpove the efficiency of marketplaces and boost business productivity, adding value for companies and customers. From trading to real estate, to software development, many business areas are being transformed.
Example: LiveRamp
In the world of marketing, ‘programmatic’ advertising platforms help serve the right messages to the right people at the right time. LiveRamp is a leader in targeted digital marketing. Its platform anonymises consumer data, securing privacy while allowing brands to reach those most interested in their products and services.

Hardware 2.0
Companies in this category are combining hardware expertise with software excellence to transform whole industries, ranging from hydrogen fuel cells to autonomous drones and space travel.
Example: PsiQuantum
One exciting innovator is PsiQuantum, a private company aiming to develop the world’s first commercial quantum computer. Using qubits that can be in multiple states simultaneously, quantum computers have speed and power in complex modelling that today’s fastest supercomputers can’t equal, unlocking new methods for drug discovery, material sciences, and encryption.
Summing up
The prevailing narrative is that small caps will continue to underperform as the universe narrows, their quality deteriorates and each company will have a progressively lower chance against the giants of the digital age. There’s some truth in this, but it’s not the whole story.
The small cap market remains incredibly deep and broad. For us it remains the place to hunt for early-stage, disruptive outliers.
We believe investors with decades of experience and a proven record of success, backed by Baillie Gifford’s stable and supportive partnership structure, are best placed to find the diamonds amid the dross.
As technology continues to transform society, current indifference towards small caps only increases the upside of these potential disruptors. There’s never been a better time to invest in these companies and our style of investing is up to the challenge – and the opportunity.
Glossary of terms:
Small cap: a public company with a market capitalisation of between $250 million and $10 billion.
Large cap: a company with a market capitalisation value of more than $10 billion.
Price-to-earnings: The price-to-earnings (P/E) ratio measures a company's share price relative to its earnings per share (EPS).
Top/bottom quintile earnings growth: A quintile is representative of 20 per cent of a given data set, dividing it into five equally sized groups. Those in the bottom quintile are the 20 per cent with the lowest earnings. Those in the top quintile are the 20 per cent with the highest earnings.
| 2020 | 2021 | 2022 | 2023 | 2024 | |
|
Baillie Gifford Edinburgh Worldwide Investment Trust* |
58.7 |
5.3 |
-43.3 |
-20.1 |
11.1 |
|
S&P Global Small Cap Index |
-1.4 |
33.6 |
-9.1 |
5.1 |
13.1 |
|
Baillie Gifford Global Discovery Fund** |
59.5 |
5.7 |
-42.9 |
-17.0 |
-3.0 |
|
S&P Global Small Cap Index + 2% |
0.5 |
35.5 |
-6.8 |
7.0 |
14.9 |
|
IA Global Sector |
7.2 |
23.2 |
-8.9 |
7.8 |
16.2 |
*Source: Morningstar, S&P, total return in sterling.
**Source: FE, Revolution, S&P. Total return net of charges, in sterling.
Past performance is not a guide to future returns.
The index data referenced herein is the property of one or more third party index provider(s) and is used under license. Such index providers accept no liability in connection with this document. For full details, see www.bailliegifford.com/legal
The manager believes that the S&P Global Small Cap + 2% per annum (in sterling) over rolling 5-year periods is an appropriate benchmark given the investment policy of the Fund and the approach taken by the manager when investing. In addition, the manager believes an appropriate performance comparison for this Fund is the Investment Association Global Sector.
Legal notice: The S&P 500 Index is the exclusive property of S&P Opco, LLC, a subsidiary of S&P Dow Jones Indices LLC (“SPDJI”) and/or its affiliates. [Licensee] has contracted with SPDJI to calculate and maintain the Index. All rights reserved. Redistribution, reproduction and/or photocopying in whole or in part are prohibited without written permission of SPDJI. S&P® is a registered trademark of Standard & Poor’s Financial Services LLC and Dow Jones® is a registered trademark of Dow Jones Trademark Holdings LLC. Neither SPDJI, its affiliates nor their third party licensors make any representation or warranty, express or implied, as to the ability of any index to accurately represent the asset class or market sector that it purports to represent, nor shall they have any liability for any errors, omissions, or interruptions of any index or the data included therein. For more information on any of SPDJI’s or its affiliate’s indices or its custom calculation services, please visit www.spdji.com.
This communication was produced and approved in November 2024 and has not been updated subsequently. It represents views held at the time of recording and may not reflect current thinking.
This communication does not constitute, and is not subject to the protections afforded to, independent research. Baillie Gifford and its staff may have dealt in the investments concerned. The views expressed are not statements of fact and should not be considered as advice or a recommendation to buy, sell or hold a particular investment.
The investment trusts managed by Baillie Gifford & Co Limited are listed UK companies and are not authorised or regulated by the Financial Conduct Authority. The value of their shares, and any income from them, can fall as well as rise and investors may not get back the amount invested.
Baillie Gifford & Co and Baillie Gifford & Co Limited is authorised and regulated by the Financial Conduct Authority (FCA).
The Edinburgh Worldwide Investment Trust and Global Discovery Fund invests in overseas securities. Changes in the rates of exchange may also cause the value of your investment (and any income it may pay) to go down or up.
Unlisted investments such as private companies, in which the Trust has a significant investment, can increase risk. These assets may be more difficult to sell, so changes in their prices may be greater.
The Edinburgh Worldwide Investment Trust can buy back its own shares. The risks from borrowing, referred to above, are increased when a trust buys back its own shares.
Market values for securities which have become difficult to trade may not be readily available and there can be no assurance that any value assigned to such securities will accurately reflect the price the Trust might receive upon their sale.
Share prices may either be below (at a discount) or above (at a premium) the net asset value (NAV). The Company may issue new shares when the price is at a premium which may reduce the share price. Shares bought at a premium may have a greater risk of loss than those bought at a discount.
Investment in smaller, immature companies is generally considered higher risk as changes in their share prices may be greater and the shares may be harder to sell. Smaller, immature companies may do less well in periods of unfavourable economic conditions.
Further details of the risks associated with investing in the Trust, including a Key Information Document and how charges are applied, can be found in the Trust specific pages at www.bailliegifford.com, or by calling Baillie Gifford on 0800 917 2112.
Further information can be found in the Key Investor Information Document (KIID) and the Prospectus. Both documents are available in English on request or by visiting www.bailliegifford.com


