

Your capital may be at risk. Past performance is not a guide to future returns.
“We live in extraordinary times” is a hackneyed phrase spectacularly overused during the pandemic. Nor is it enough of an excuse for the poor returns endured by our clients over the past two years or more. However, it is fair to say that we have been through a period of extraordinary volatility.
Our investment approach means that we and our clients might expect volatility against the market. After all we invest in growth companies for the long term and as such our portfolios have high active share and look nothing like the index. Such swings can bring opportunity, and returns should smooth out over time.
It is worth stating that volatility is not the same as risk, although it can feel like it. The level of volatility seen in 2020-2022 was extreme and there are few moments of recent history to compare it to, as the chart below, showing bond and equity returns, suggests.
2022 was an unprecedented year
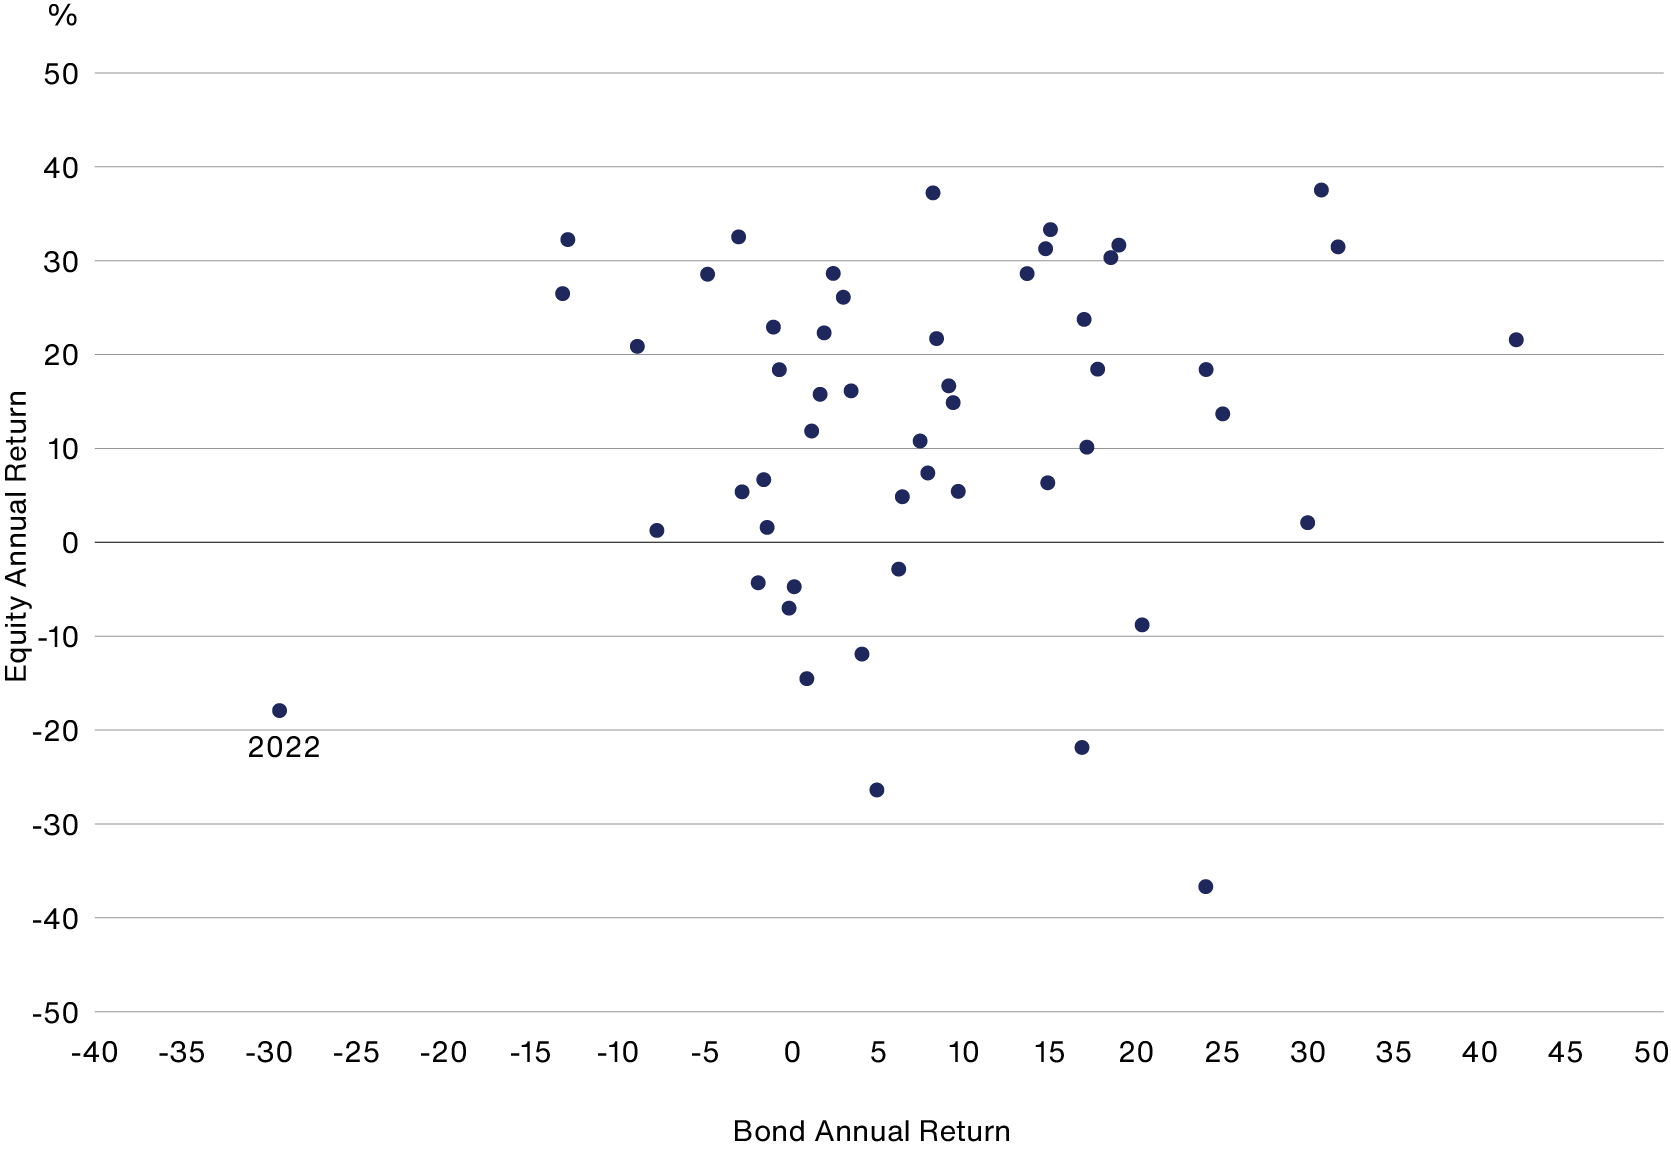
Source: Morningstar Direct, S&P. Bloomberg US Treasury Long and S&P 500 total return, US dollar 1973-2023.
We saw volatility on both the upside and the downside as the winners of Covid became the losers very quickly. We were invested in many of the winners and as a result our portfolios significantly outperformed in 2020 – some even doubled over that 12-month period. Yet the drawdown was as savage in 2022 as winners were punished as the world returned to near normal, as the table below illustrates.
| 2020 | 2022 | |
| Amazon | 76 | -50 |
| Delivery Hero | 96 | -56 |
| Meituan | 191 | -23 |
| Moderna | 434 | -29 |
| Ocado | 85 | -67 |
| Peloton | 434 | -78 |
| Shopify | 185 | -75 |
| Tesla | 743 | -65 |
| Wayfair | 150 | -83 |
| Zoom | 396 | -63 |
Share price, total return, USD.
We have sold some of these companies since, as we believe the investment case has played out. But we remain confident of the growth prospects of others, like Moderna and Shopify for example. If not extraordinary these were times of unusual volatility. The extent of which we don’t believe will be repeated in a hurry.
While the volatility of the pandemic years may have been extreme, our experience of investing through other downturns gives us reason for optimism. The following chart shows the average rolling five-year performance relative to the index for all of Baillie Gifford’s UK-domiciled equity fund range. It illustrates that, for the vast majority of the time, our funds have collectively outperformed over five-year periods.
Rolling 5-year annualised returns for our equity funds relative to their indices

In charting this, we looked at each equity fund’s outperformance (or underperformance) compared to the fund’s relevant index over five-year periods for each quarter since that fund’s inception. Then, for each quarter, we calculated the average of outperformance or underperformance across all equity funds and plotted that across the timeline shown in the graph, where the 0% axis represents the index return. Overall, the chart demonstrates a clear pattern of historic performance for our fund range as a whole, though the volatility of each individual fund may be greater.
Source: FE, Revolution and relevant index providers. Longest running share class used for each fund. Share class returns B Acc or B Inc based on 10am NAV prices. Index calculated close to close.
For the 30-year available history, outperformance over five years has averaged +1.9 per cent per annum (pa). The current situation is that, having peaked at +9.8 per cent pa in January 2021, the very sharp sell-off in growth equities has resulted in an underperformance of -1.9 per cent pa in the five years to the end of March 2024, for our equity fund range as a whole.
We have seen such periods from January 1995 to June 1997 and September 2008 to November 2009. In both cases, strong recoveries in performance have followed over the next five years. There can be no guarantee that this will happen again, but we hope it will be informative for investors to see the long-term pattern of relative fund performance resulting from our investment style.
Lessons learned
While we think that history won’t necessarily repeat itself, it often rhymes as Mark Twain reputedly said. Crucially, we understand that there are lessons to be learned from it for the future.
The natural inclination of asset managers is to say that philosophy and process never changes. This is a marketing line that works fine when times are good. Even when times are bad, we cannot afford any accusation of style drift, but we should be brave enough to articulate how our process may be enhanced through experience.
Asset management is a competitive industry, and if you are not moving forward, you are moving backward. As a business, we believe in a culture of continuous improvement in the management of our funds and trusts. We don’t want to fight the last war, but if it happens, we want to emerge from it stronger and with better outcomes for our clients.
At Baillie Gifford we are constantly trying to improve and hone our processes. You’ll have heard us previously speak about deepening our relationships with academics and growing our private equity business to develop alternative sources of insight not widely available to our peers. However, as with all walks of life when you go through a difficult period, as we have, it has highlighted other areas of our investment process that can be refined.
To this end, we have improved our approach to risk. Back in 2020/21, we did not anticipate that inflation and interest rate risks would correlate so highly across a wide range of businesses and geographies. Our investment teams focused on the pricing power and low levels of indebtedness of our individual holdings and were satisfied that they were less at risk than growth stocks in general.
As it turned out, the market did not see this difference, and our high-duration bias damaged returns. Learning from this, we have embedded inflation and equity duration analysis into our risk team’s regular interactions with investment teams and have seen strong traction as they reflect on its now more evident importance. Moreover, this has boosted engagement with investment teams on other emerging thematic risks that could be particularly impactful on portfolios.

Returns in 2022 clearly necessitated reflection on our part as to where we might have more robustly challenged valuations. As a result, we have implemented two regular proprietary inputs into our risk work.
First, we developed a tool called a valuation heatmap. It uses data such as valuation levels, growth expectations, and 30-plus years of global historic returns to identify clusters of companies in our portfolios that might be overvalued, compared to our growth expectations. This enhances the context and challenge for investment teams, helping to improve decisions and disciplines for purchasing, holding, and selling positions. Then we look at correlation and network effects, prompting further discussion of portfolio balance and risk clusters.
Other areas include quality and resilience analysis, considering how much cash companies have in reserve against an economic backdrop of more scarce and expensive capital.
Behavioural analysis of trading decisions from our risk team has provided feedback on decision-making patterns for many of our funds and trusts. This considers purchasing patterns and sell discipline, supporting investment teams in improving their decision-making processes.
At a portfolio level, Global Alpha and Monks Investment Trust introduced guidelines that monitor how many holdings sit within three growth profiles (Rapid, Stalwarts, and Cyclical). If breached, this triggers a review by the risk team. Also, they have taken steps to broaden their reach across Baillie Gifford’s investment teams to widen the funnel of ideas.
Additionally, Edinburgh Worldwide’s portfolio managers identified potential improvements to both processes and tactics to assist the balance of the portfolio. These include being more rigorous in recognising stocks that have had a good run, taking profits where appropriate, and being more ruthless in addressing issues in the underperforming tail of the portfolio where the portfolio managers may have tended in the past to err on the side of patience.
Stagnation not stagflation
We have come through rising inflation and rising interest rates. Inflation staggered but has subsided and the next move for rates would appear to be down. Sentiment around growth investing may improve. However, cuts have not materialised. Geopolitics and conflicts remain causes for concern in the minds of investors. The investments of choice are short term in nature, such as bonds and money market funds, where yields are attractive, and the index, where big tech has dominated, driven by the AI zeitgeist.
It has been an uncomfortable period for active management. Put simply, you were either with the Magnificent Seven1 or against them, and for a period being underweight has been costly. These companies are not new to us. We bought Nvidia in 2016 and Amazon in 2004, but they have been a popular trade and have obscured the progress of other companies both public and private. This may be beginning to change as investors critically weigh up valuations for the Magnificent Seven against present-day results and future earnings prospects. At some stage, the operational success of a wider group of businesses will be recognised by the market in share price terms.
Actual investing
We brand ourselves as Actual Investors rather than just active. Our focus is on deploying capital into the growth companies we think likeliest to generate outsized investment returns. It is about finding the outliers and the big winners over the next 5-10 years.
Research suggests that markets are driven by small numbers of very successful companies. The Magnificent Seven fit this bill. But we believe that the opportunity set is wider than this and, unlike many other active managers, we are prepared to break free of the constraints of marginally underweighting or overweighting an index.
The last decade was dominated by capital-lite businesses able to scale up on the back of cheap money. We have entered a new world where investors are looking for companies to evidence profitability, where capital is expensive and old-fashioned long-term investment is needed to find solutions to the problems we all face. This will require patience and resilience that high-turnover active managers have in short supply.
But the opportunities are many. We live in a world of disruption and innovation, and this has not dimmed in the face of global challenges. Digitalisation rules everything we do. ByteDance (TikTok) has become the world’s largest private company, MercadoLibre dominates South American ecommerce, while Shopify has evolved into the B2B platform of choice for many businesses. Healthcare has taken a back seat in terms of investment returns since the pandemic, as investors focus on the bottom line, but this may be about to change.
The confluence of big data and biotech, and the resultant emergence of new platforms, has seen significant progress in medical terms made by Moderna and Alnylam as yet to be reflected in their respective share prices. Technological advances are powering pioneers such as SpaceX (satellite communications) and Zipline (delivery drones) while the well-trodden paths of Artificial Intelligence and the Climate Transition continue to throw up a widening set of possibilities.
Growth appears cheap
Over the past couple of years, we have assessed each of our holdings as to the ongoing investment case for each and their ability to endure the challenges of higher interest rates and increased cost of capital. This has led to sales of companies that featured during the Covid era – Peloton and Zoom come to mind. But the majority of holdings have shown great resilience and offer significant prospects for growth from here.
Taking Monks as an example, forward growth statistics (as of the end May 24) are promising. The expected 3-year forward growth in sales for the portfolio is 7.8 per cent per annum against 4.3 per cent for the index, and expected growth in earnings 14.7 per cent per annum versus 9.7 per cent for the index. This is a trend seen across many of the funds and trusts we manage. Yet, as the discounts between share price and net asset value across the range of Baillie Gifford-managed trusts suggest, valuations do not point to the existence of a premium for growth in the current environment.
This can change and possibly sooner than expected. Perhaps we do live in extraordinary times after all.
[1]The 'Magnificent Seven' refers to a group of historically high-performing US stocks: Alphabet, Amazon, Apple, Meta, Microsoft, NVIDIA, and Tesla.
| 2020 | 2021 | 2022 | 2023 | 2024 | |
| Baillie Gifford Global Alpha Growth Fund | 17.2 | 31.2 | -23.9 | 11.8 | 14.5 |
| Index* | 5.7 | 25.1 | -3.7 | 11.9 | 20.6 |
| Target** | 7.9 | 27.6 | -1.8 | 14.2 | 23.0 |
| Sector Average*** | 5.4 | 25.9 | -8.8 | 10.8 | 14.9 |
Source: FE, Revolution, MSCI. Net of fees, total return in sterling. Class B Acc Shares. Share class returns calculated using 10am prices, while the Index is calculated close-to-close.
*MSCI ACWI Index
**MSCI ACWI Index (in sterling) plus at least 2% per annum over rolling five-year periods.
***IA Global Sector
Past performance is not a guide to future returns.
The manager believes an appropriate comparison for this Fund is the Investment Association Global Sector median given the investment policy of the Fund and the approach taken by the manager when investing.
Investment markets can go down as well as up and market conditions can change rapidly. The value of an investment in the Fund, and any income from it, can fall as well as rise and investors may not get back the amount invested.
Important information and risk factors
This recording was produced and approved in July 2024 and has not been updated subsequently. It represents views held at the time and may not reflect current thinking.
The views expressed should not be considered as advice or a recommendation to buy, sell or hold a particular investment. They reflect opinion and should not be taken as statements of fact nor should any reliance be placed on them when making investment decisions.
This communication contains information on investments which does not constitute independent research. Accordingly, it is not subject to the protections afforded to independent research, and Baillie Gifford and its staff may have dealt in the investments concerned.
The Fund’s share price can be volatile due to movements in the prices of the underlying holdings and the basis on which the Fund is priced.
Baillie Gifford & Co and Baillie Gifford & Co Limited are authorised and regulated by the Financial Conduct Authority (FCA). Baillie Gifford & Co Limited is an Authorised Corporate Director of OEICs.
Further details of the risks associated with investing in the Fund can be found in the Key Investor Information Document, copies of which are available at www.bailliegifford.com, or the Prospectus which is available by calling the ACD.
Legal notices
S&P: The S&P 500 Index is a product of S&P Dow Jones Indices LLC, a division of S&P Global, or its affiliates (“SPDJI”). Standard & Poor’s® and S&P® are registered trademarks of Standard & Poor’s Financial Services LLC, a division of S&P Global (“S&P”); Dow Jones® is a registered trademark of Dow Jones Trademark Holdings LLC (“Dow Jones”). Neither S&P Dow Jones Indices LLC, Dow Jones Trademark Holdings LLC, their affiliates nor their third party licensors make any representation or warranty, express or implied, as to the ability of any index to accurately represent the asset class or market sector that it purports to represent and neither S&P Dow Jones Indices LLC, Dow Jones Trademark Holdings LLC, their affiliates nor their third party licensors shall have any liability for any errors, omissions, or interruptions of any index or the data included therein.
MSCI: MSCI makes no express or implied warranties or representations and shall have no liability whatsoever with respect to any MSCI data contained herein. The MSCI data may not be further redistributed or used as a basis for other indexes or any securities or financial products. This report is not approved, endorsed, reviewed or produced by MSCI. None of the MSCI data is intended to constitute investment advice or a recommendation to make (or refrain from making) any kind of investment decision and may not be relied on as such.
109150 10048749