As with any investment, your capital is at risk.
Conventional financial theory has it that, in the long term, shares in smaller businesses outperform those in larger businesses — the so-called small cap premium.
But in the last decade, larger businesses have trounced smaller ones, especially in the US, where they’ve outperformed small caps by 140 per cent.
What happened to that premium?
Perception vs reality
Recent underperformance has largely been driven by indiscriminate derating of valuations, rather than problems with small cap companies themselves. Investors are now less willing than five years ago to pay for small cap earnings. Small cap investors have suffered as a result.
Price to earnings ratio of small cap class relative to large cap
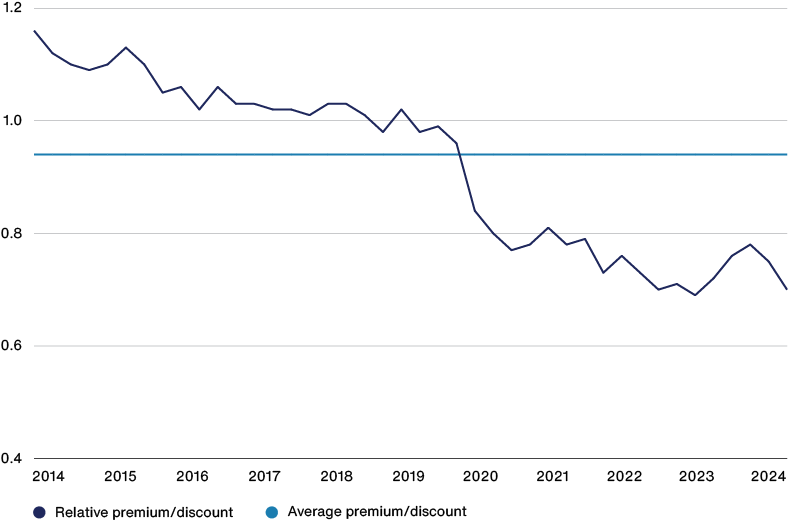
Source: FactSet, MSCI. Data 30 June 2014 to 30 June 2024. MSCI ACWI Small Cap vs MSCI ACWI Large Cap. US dollars. EMEIS Holdings has been excluded.
Now valuations are at their lowest levels relative to large caps since 2008, when the global financial crisis scared many investors out of the asset class. In the US they’re as low as they were in 1999, another time when there were a few highly valued IT names and intense concentration in large cap indices. A decade of stellar returns followed the turn of the millennium.
What’s driven this recent underperformance? First, interest rates. Small caps need more external capital and they’re more exposed to rate changes. Their prices tend to be more sensitive, given that expected cashflows lie further in the future. No wonder they’ve suffered from aggressive rate hikes.
Other narratives suggest deeper problems. They present small cap strife as not just a cyclical phenomenon, but as evidence of an asset class doomed to underperform its bigger equivalent. In this reading, the small cap premium is dead and buried.
The size of the pool
For some, the fact that there are fewer listed companies means the scope for outperformance is correspondingly less. Taking the US market as representative, there are now fewer listed businesses than there were 20 years ago. Increased market regulation and more available venture and private equity capital have encouraged companies to stay private for longer – or to delist.
This makes sense. We’ve been investing in private companies for almost a decade, seeking to ensure we don’t miss the disruptors of tomorrow.
But the correlation between volume and outperformance isn’t so simple. It’s the number of the smallest listed companies, the micro caps, that has reduced most. The number of stocks in our favoured small and mid-size category has stayed roughly the same.
This global market remains huge. Our benchmark S&P Global SmallCap index holds more than 11,000 companies, and there are tens of thousands beyond that. The pool may be shrinking, but it’s still much larger than the large cap universe, offering more than enough choice for a portfolio of around 100 stocks.
Only the best
The second argument against small caps is that they tend to be poor quality, with shaky balance sheets, inferior growth prospects, and lower profitability.
There is data to support this. On average, small caps do underperform larger businesses. Large caps have delivered better five-year earnings growth for each of the last five years.
But the term ‘on average’ is key. Yes, most smaller businesses are low quality. But that’s why we’re looking for the exceptional few capable of becoming much larger.
For our experienced team, the ‘average’ small cap is irrelevant. It’s the difference between the best and the worst that’s interesting. The fastest-growing smaller companies continually outperform the fastest-growing larger ones.
Top quintile earnings growth (%)
Bottom quintile earnings growth (%)
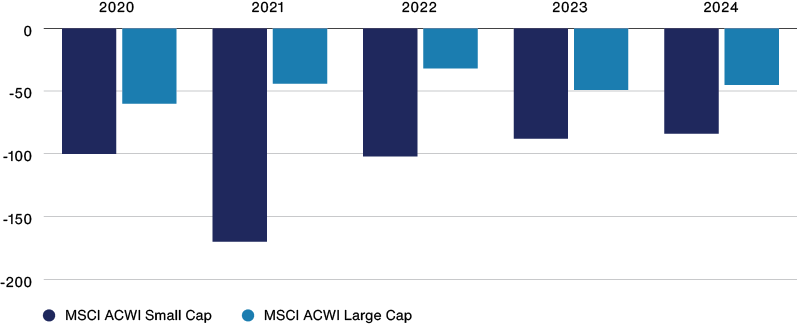
Source: FactSet, MSCI. US dollars. Data to 31 July each year. Based on 1yr earnings-per-share inc neg.
We believe the best way to find this exciting growth is through tried-and-tested active management that can filter for quality and potential, ignoring the junk.
Beyond scale benefits
Here’s another argument against small caps: in the digital age, the benefits of scale – data, compute, or storage – are clearer than ever. You only need to look at giants such as NVIDIA, Microsoft, Apple and Alphabet that are driving markets to new heights.
Again, we agree. There’s plenty of evidence for the scale advantage of big tech. An early realisation of this has been hugely beneficial to Baillie Gifford clients over the last decade.
But it doesn’t follow that, because the tech sector shows higher returns to scale, opportunities for disruptive innovation are dead. Far from it. In the 10 years that larger tech companies have dominated, small cap disruptors have still triumphed, seizing opportunities for exponential returns. Taking examples from our transformational holdings that began as small caps:
- DexCom (bought 2012, sold 2021) allowed diabetics to monitor their blood glucose on the go. Its focus and innovation provided the best product, tailored a sales operation and prioritised the amassing of clinical evidence to dominate the US market, outcompeting less focused competitors.
- Tesla (bought 2013, sold 2022) challenged incumbents suffering from the classic ‘innovators dilemma’. The entrenched processes of car makers made them wary of cannibalising their internal combustion model to invest in EVs. Tesla’s ‘first principles’ approach to design, manufacturing, automation and battery technology allowed it to seize the lead.
- Axon (bought 2018) brought disruptive innovation to a traditional area, cornering the market in Tasers, bodycams, and software for law enforcement, a market that competitors ignored. Its products have vastly improved efficiency.
In summary: we don’t deny the shrinking of the small cap universe, the poor quality of many small caps, or the benefits of scale.
But you shouldn’t confuse these factors with proof of an asset class in structural decline. We can equally point to a remaining deep pool of companies, some with incredible growth potential, which can challenge incumbents and win.
On the upside
The good news for our investors is that negative sentiment has lowered valuations, providing an incredible opportunity for long-term stock pickers.
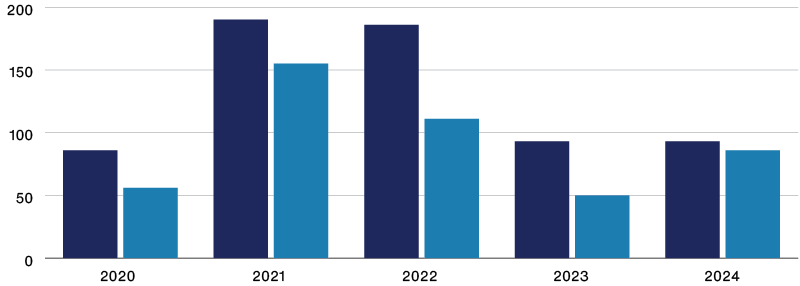
Our strategy is to harness long-term equity asymmetry. We seek the special few that can sustain long-term high growth, delivering multiples of the initial investment. A good barometer for such companies is whether they can deliver a five-times return over five years.
Percentage of companies delivering 5x return

Number of companies delivering 5x return

Source: Baillie Gifford & Co, S&P. Base Rate Analysis. US dollars. Based on S&P 500. Data from 31 December 2003 to 31 December 2023.
We recently analysed the proportion of such companies in the US market over the last 20 years. For companies with a market cap between $300m and $10bn, there were 50 per cent more five-times returners than in the S&P 500. That’s a lot.
The difference is even starker when you look at the number of companies delivering a five-times return. Our investable universe produced almost nine times as many five-time returners as the S&P 500.
These outliers tend to be the areas with the most innovation. Technology and healthcare make up 45 per cent of five-times companies, with biotech, semiconductors, and software the highest represented industries.
So, in summary, the small-cap universe remains the place to look for future outliers that can become tomorrow’s tech champions.
Potential, not size
We search for immature greatness, not just small size. Market cap size tells you nothing about potential. We’re looking for four traits:
- Innovation directed at solving big problems
- A defensible competitive edge
- Visionary, high-quality management
- Returns that scale with growth
Companies with all four have a higher chance of delivering outsized returns.
What then do tomorrow’s disruptors look like? Experience has led us to some promising categories, including healthcare, digital infrastructure and transformative hardware. Here are some examples:

Healthcare revolution
Advances in genetic sequencing capabilities, combined with increased data processing power are ushering in a new era of preventative, personalised healthcare. The convergence is helping to transform patient outcomes for the better.
Example: Alnylam
A pioneer in this sector, Alnylam has created drugs that can ‘silence’ the faulty genes that cause diseases, a scalable platform that can be used for many targets. Industry-wide, only 6 per cent of drugs make it to market, but Alnylam has delivered more than 60 per cent, the highest returning model the industry has seen. Therapies for cardiovascular disease, Alzheimer’s and diabetes are in the pipeline.

Digital infrastructure
New AI-enabled digital tools and technologies improve the efficiency of marketplaces and boost business productivity, adding value for companies and customers. From trading to real estate, to software development, many business areas are being transformed.
Example: LiveRamp
In the world of marketing, ‘programmatic’ advertising platforms help serve the right messages to the right people at the right time. LiveRamp is a leader in targeted digital marketing. Its platform anonymises consumer data, securing privacy while allowing brands to reach those most interested in their products and services.

Hardware 2.0
Companies in this category are combining hardware expertise with software excellence to transform whole industries, ranging from hydrogen fuel cells to autonomous drones and space travel.
Example: PsiQuantum
One exciting innovator is PsiQuantum, a private company aiming to develop the world’s first commercial quantum computer. Using qubits that can be in multiple states simultaneously, quantum computers have speed and power in complex modelling that today’s fastest supercomputers can’t equal, unlocking new methods for drug discovery, material sciences, and encryption.
Summing up
The prevailing narrative is that small caps will continue to underperform as the universe narrows, their quality deteriorates and each company will have a progressively lower chance against the giants of the digital age. There’s some truth in this, but it’s not the whole story.
The small cap market remains incredibly deep and broad. For us it remains the place to hunt for early-stage, disruptive outliers.
We believe investors with decades of experience and a proven record of success, backed by Baillie Gifford’s stable and supportive partnership structure, are best placed to find the diamonds amid the dross.
As technology continues to transform society, current indifference towards small caps only increases the upside of these potential disruptors. There’s never been a better time to invest in these companies and our style of investing is up to the challenge – and the opportunity.
Glossary of terms:
Small cap: a public company with a market capitalisation of between $250 million and $10 billion.
Large cap: a company with a market capitalisation value of more than $10 billion.
Price-to-earnings: The price-to-earnings (P/E) ratio measures a company's share price relative to its earnings per share (EPS).
Top/bottom quintile earnings growth: A quintile is representative of 20 per cent of a given data set, dividing it into five equally sized groups. Those in the bottom quintile are the 20 per cent with the lowest earnings. Those in the top quintile are the 20 per cent with the highest earnings.
| 2020 | 2021 | 2022 | 2023 | 2024 | |
|
Worldwide Discovery Composite |
67.8 |
7.2 |
-49.4 |
-6.6 |
12.1 |
|
MSCI ACWI Small Cap Index |
3.7 |
41.1 |
-24.4 |
15.8 |
25.2 |
| 1 year | 5 years | 10 years | |
|
Worldwide Discovery Composite |
12.1 |
-1.0 |
4.3 |
|
MSCI ACWI Small Cap Index |
25.2 |
9.9 |
8.2 |
*Inception date: 30 June 2017.
Source: Revolution, MSCI. US dollars. Returns have been calculated by reducing the gross return by the highest annual management fee for the composite. 1 year figures are not annualised.
Past performance is not a guide to future returns.
Legal notice: MSCI makes no express or implied warranties or representations and shall have no liability whatsoever with respect to any MSCI data contained herein. The MSCI data may not be further redistributed or used as a basis for other indexes or any securities or financial products. This report is not approved, endorsed, reviewed or produced by MSCI. None of the MSCI data is intended to constitute investment advice or a recommendation to make (or refrain from making) any kind of investment decision and may not be relied on as such.
Risk factors
The views expressed should not be considered as advice or a recommendation to buy, sell or hold a particular investment. They reflect opinion and should not be taken as statements of fact nor should any reliance be placed on them when making investment decisions.
This communication was produced and approved in November 2024 and has not been updated subsequently. It represents views held at the time of writing and may not reflect current thinking.
Potential for profit and loss
All investment strategies have the potential for profit and loss, your or your clients’ capital may be at risk. Past performance is not a guide to future returns.
This communication contains information on investments which does not constitute independent research. Accordingly, it is not subject to the protections afforded to independent research, but is classified as advertising under Art 68 of the Financial Services Act (‘FinSA’) and Baillie Gifford and its staff may have dealt in the investments concerned.
All information is sourced from Baillie Gifford & Co and is current unless otherwise stated.
The images used in this communication are for illustrative purposes only.
Past performance is not a guide to future returns.
Legal notice: MSCI makes no express or implied warranties or representations and shall have no liability whatsoever with respect to any MSCI data contained herein. The MSCI data may not be further redistributed or used as a basis for other indexes or any securities or financial products. This report is not approved, endorsed, reviewed or produced by MSCI. None of the MSCI data is intended to constitute investment advice or a recommendation to make (or refrain from making) any kind of investment decision and may not be relied on as such.
Important information
Baillie Gifford & Co and Baillie Gifford & Co Limited are authorised and regulated by the Financial Conduct Authority (FCA). Baillie Gifford & Co Limited is an Authorised Corporate Director of OEICs.
Baillie Gifford Overseas Limited provides investment management and advisory services to non-UK Professional/Institutional clients only. Baillie Gifford Overseas Limited is wholly owned by Baillie Gifford & Co. Baillie Gifford & Co and Baillie Gifford Overseas Limited are authorised and regulated by the FCA in the UK.
Persons resident or domiciled outside the UK should consult with their professional advisers as to whether they require any governmental or other consents in order to enable them to invest, and with their tax advisers for advice relevant to their own particular circumstances.
Financial intermediaries
This communication is suitable for use of financial intermediaries. Financial intermediaries are solely responsible for any further distribution and Baillie Gifford takes no responsibility for the reliance on this document by any other person who did not receive this document directly from Baillie Gifford.
Europe
Baillie Gifford Investment Management (Europe) Ltd (BGE) is authorised by the Central Bank of Ireland as an AIFM under the AIFM Regulations and as a UCITS management company under the UCITS Regulation. BGE also has regulatory permissions to perform Individual Portfolio Management activities. BGE provides investment management and advisory services to European (excluding UK) segregated clients. BGE has been appointed as UCITS management company to the following UCITS umbrella company; Baillie Gifford Worldwide Funds plc. BGE is a wholly owned subsidiary of Baillie Gifford Overseas Limited, which is wholly owned by Baillie Gifford & Co. Baillie Gifford Overseas Limited and Baillie Gifford & Co are authorised and regulated in the UK by the Financial Conduct Authority.
Hong Kong
Baillie Gifford Asia (Hong Kong) Limited 柏基亞洲(香港)有限公司 is wholly owned by Baillie Gifford Overseas Limited and holds a Type 1 license from the Securities & Futures Commission of Hong Kong to market and distribute Baillie Gifford’s range of collective investment schemes to professional investors in Hong Kong. Baillie Gifford Asia (Hong Kong) Limited 柏基亞洲(香港)有限公司 can be contacted at Suites 2713-2715, Two International Finance Centre, 8 Finance Street, Central, Hong Kong. Telephone +852 3756 5700.
South Korea
Baillie Gifford Overseas Limited is licensed with the Financial Services Commission in South Korea as a cross border Discretionary Investment Manager and Non-discretionary Investment Adviser.
Japan
Mitsubishi UFJ Baillie Gifford Asset Management Limited (‘MUBGAM’) is a joint venture company between Mitsubishi UFJ Trust & Banking Corporation and Baillie Gifford Overseas Limited. MUBGAM is authorised and regulated by the Financial Conduct Authority.
Australia
Baillie Gifford Overseas Limited (ARBN 118 567 178) is registered as a foreign company under the Corporations Act 2001 (Cth) and holds Foreign Australian Financial Services Licence No 528911. This material is provided to you on the basis that you are a “wholesale client” within the meaning of section 761G of the Corporations Act 2001 (Cth) (“Corporations Act”). Please advise Baillie Gifford Overseas Limited immediately if you are not a wholesale client. In no circumstances may this material be made available to a “retail client” within the meaning of section 761G of the Corporations Act.
This material contains general information only. It does not take into account any person’s objectives, financial situation or needs.
South Africa
Baillie Gifford Overseas Limited is registered as a Foreign Financial Services Provider with the Financial Sector Conduct Authority in South Africa.
North America
Baillie Gifford International LLC is wholly owned by Baillie Gifford Overseas Limited; it was formed in Delaware in 2005 and is registered with the SEC. It is the legal entity through which Baillie Gifford Overseas Limited provides client service and marketing functions in North America. Baillie Gifford Overseas Limited is registered with the SEC in the United States of America.
The Manager is not resident in Canada, its head office and principal place of business is in Edinburgh, Scotland. Baillie Gifford Overseas Limited is regulated in Canada as a portfolio manager and exempt market dealer with the Ontario Securities Commission (‘OSC’). Its portfolio manager licence is currently passported into Alberta, Quebec, Saskatchewan, Manitoba and Newfoundland & Labrador whereas the exempt market dealer licence is passported across all Canadian provinces and territories. Baillie Gifford International LLC is regulated by the OSC as an exempt market and its licence is passported across all Canadian provinces and territories. Baillie Gifford Investment Management (Europe) Limited (‘BGE’) relies on the International Investment Fund Manager Exemption in the provinces of Ontario and Quebec.
Israel
Baillie Gifford Overseas Limited is not licensed under Israel’s Regulation of Investment Advising, Investment Marketing and Portfolio Management Law, 5755–1995 (the Advice Law) and does not carry insurance pursuant to the Advice Law. This material is only intended for those categories of Israeli residents who are qualified clients listed on the First Addendum to the Advice Law.
Singapore
Baillie Gifford Asia (Singapore) Private Limited is wholly owned by Baillie Gifford Overseas Limited and is regulated by the Monetary Authority of Singapore as a holder of a capital markets services licence to conduct fund management activities for institutional investors and accredited investors in Singapore. Baillie Gifford Overseas Limited, as a foreign related corporation of Baillie Gifford Asia (Singapore) Private Limited, has entered into a cross-border business arrangement with Baillie Gifford Asia (Singapore) Private Limited, and shall be relying upon the exemption under regulation 4 of the Securities and Futures (Exemption for Cross-Border Arrangements) (Foreign Related Corporations) Regulations 2021 which enables both Baillie Gifford Overseas Limited and Baillie Gifford Asia (Singapore) Private Limited to market the full range of segregated mandate services to institutional investors and accredited investors in Singapore.
124201 10050863